
DATA & INSIGHTS: ORTHOPEDICS
Leveraging data in every aspect of operations is now essential for long-term success.
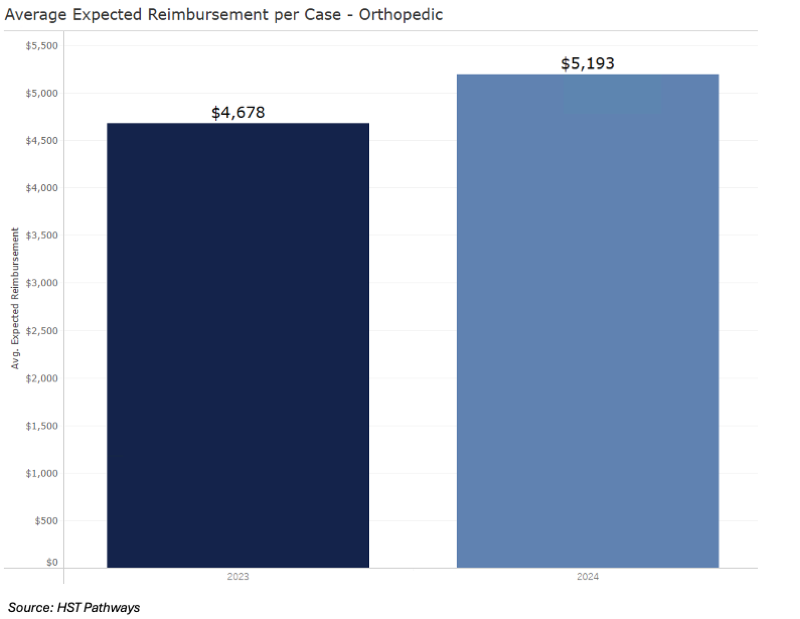
Orthopedics remains the top revenue-generating specialty in ASCs, with net revenue per case rising from $6,141 in 2023 to $6,419 in 2024. As patient demand surges and payer reimbursement strengthens, ASCs must optimize key metrics to capture growth opportunities while maintaining efficiency and profitability. Explore the latest orthopedic surgery center trends below.
This data represents 437,971 unique cases across 338 centers.
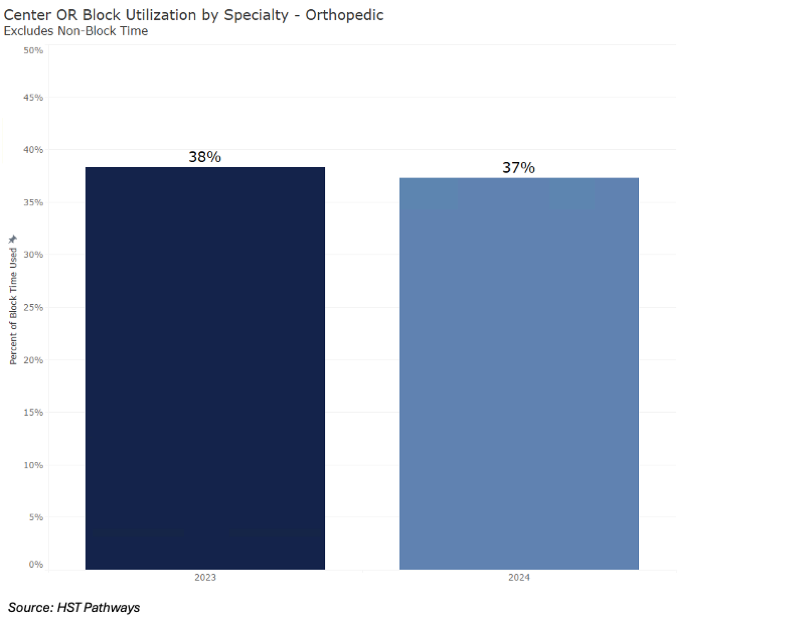
OR Block Utilization
Slight decline—OR block utilization decreased from 38% to 37%.
Seamless communication between a doctor’s office and the ASC is key to driving case volume. Avoid phone and fax delays—use technology to broadcast OR availability, enable electronic scheduling, and automate block time management to improve efficiency and achieve at least 70% utilization.
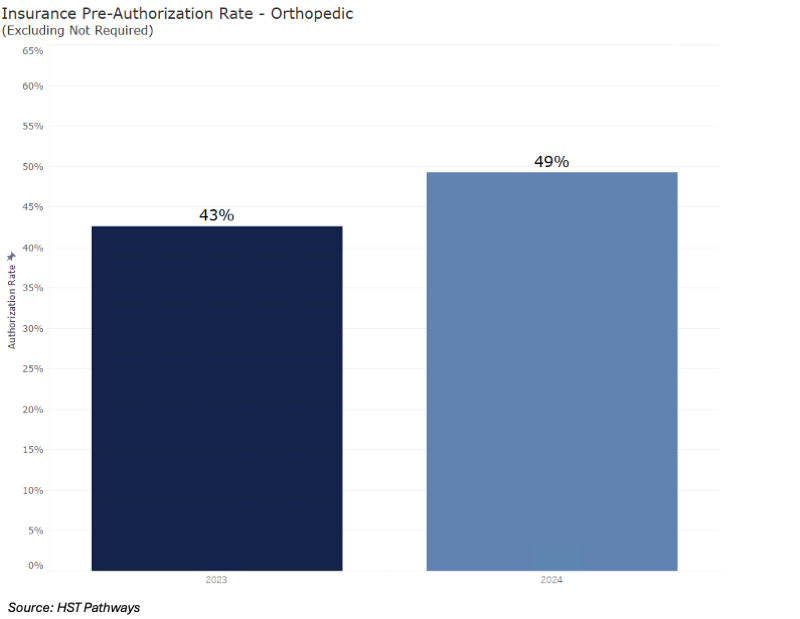
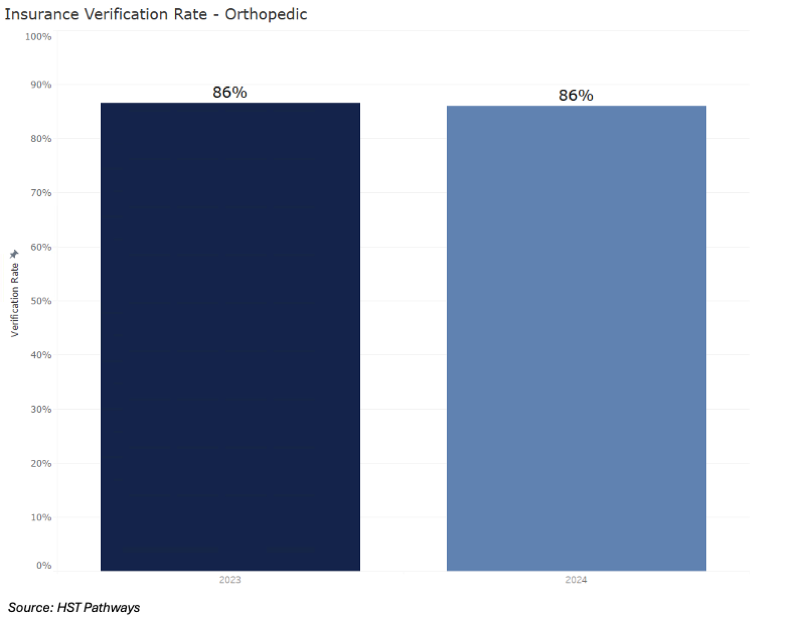
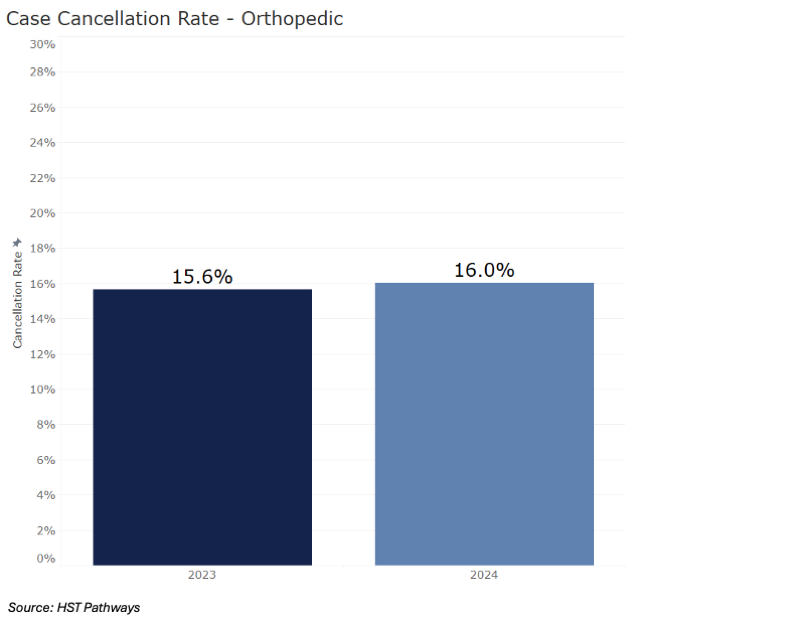
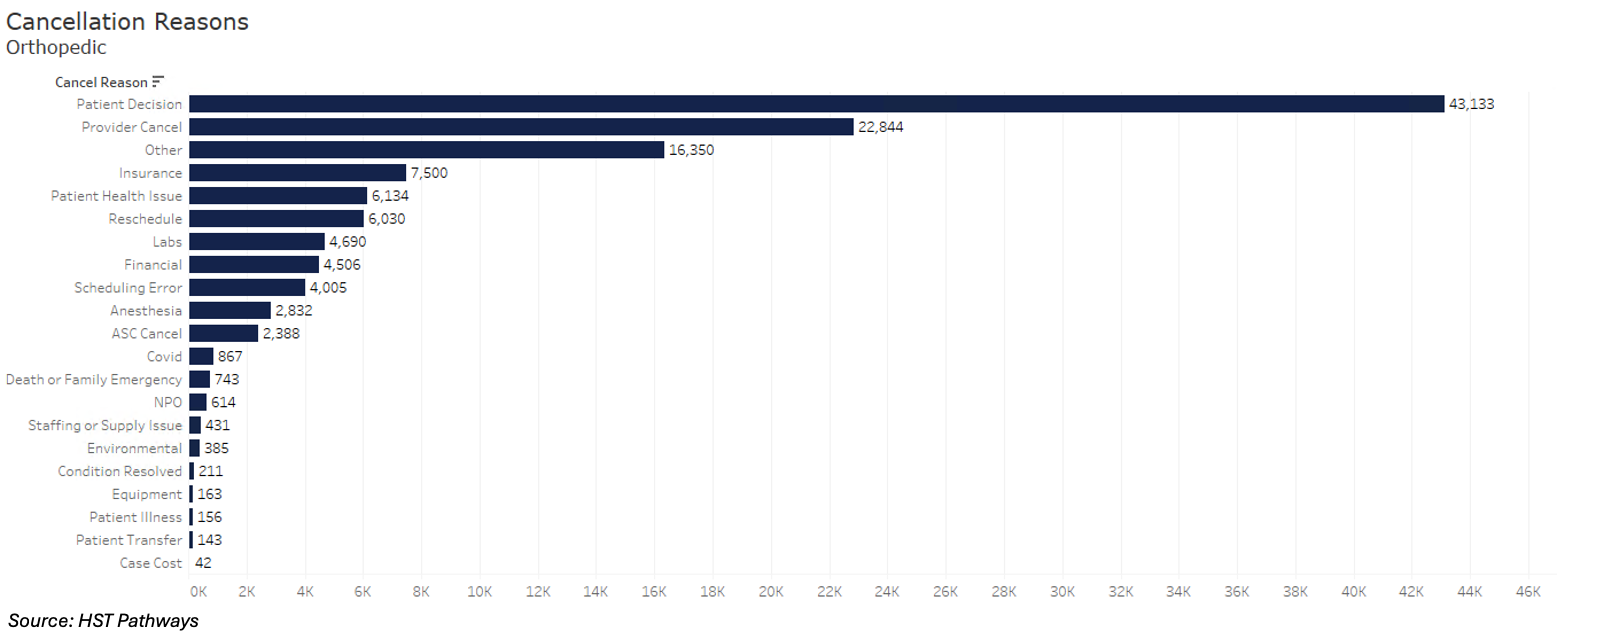
Case Cancellation Reasons
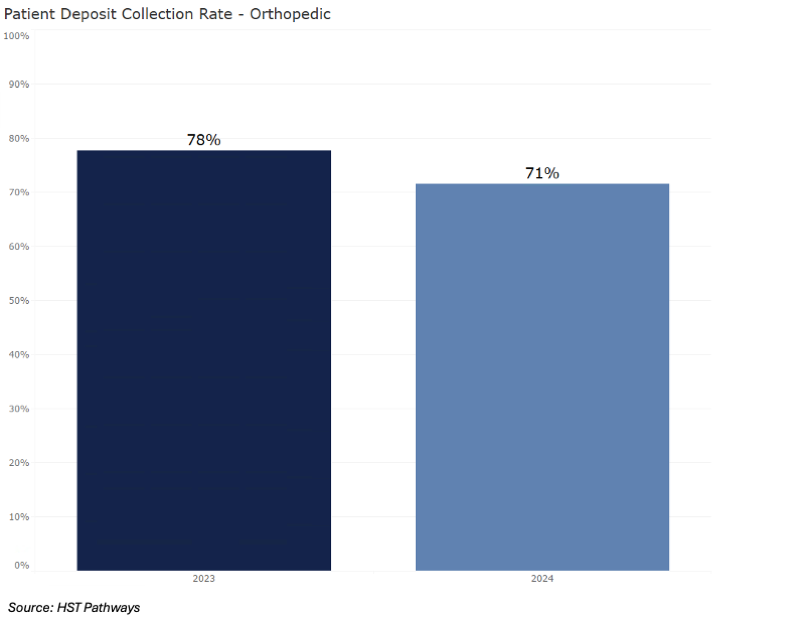
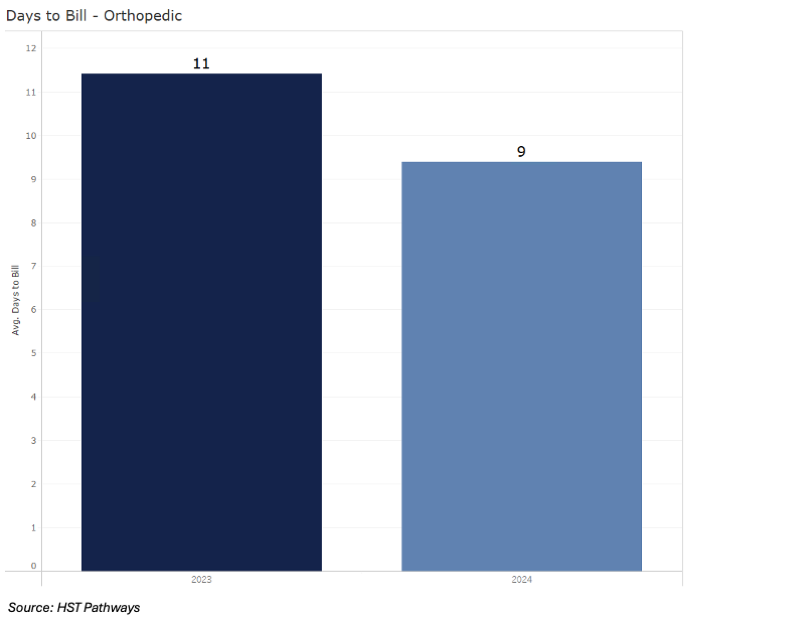
Days to Bill
Billing turnaround improved—average days to bill dropped from 11 to 9.
Accurate coding and charge entry are essential for reimbursement and compliance. Integrating EHR and billing systems reduces errors and streamlines the process. Using well-trained coders and tracking denials helps prevent mistakes, improving financial health and operational efficiency.
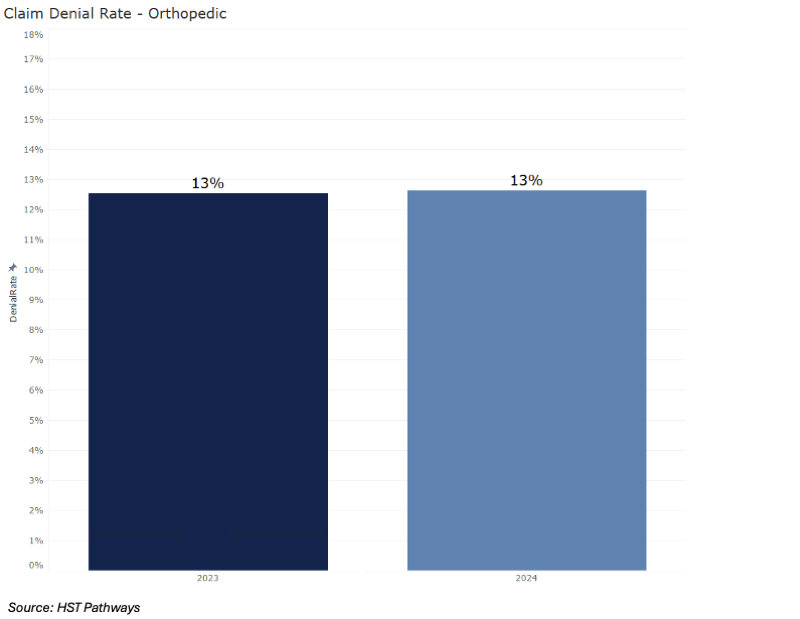
Claim Denial Rate
No change—denial rate remains steady at 13%.
Efficient claim management is essential for maintaining cash flow and compliance. Using EHR, practice management, and electronic claims systems streamlines submissions and reduces errors. Regularly monitoring claims helps address denials quickly, ensuring timely reimbursement and sustaining operational efficiency.
Get access to:
*Disclaimer: HST Pathways released an updated version of our State of the Industry Report in September 2024, highlighting best practices, key process steps, and KPIs for every step of the patient journey and for nearly every recurring administrative duty. Most importantly, using our own unique dataset from our clients, we were able to extract data points so that anyone in the industry could compare themselves to their peers. We only pulled data from clients who gave us permission, and we omitted any extreme outliers. Data on this page may differ from the full 2024 State of the ASC Industry report. The full report (published September 2024) included data through Q2 2024, while this page (published March 2025) includes data through Q4 2024. Differences are due to the extended timeframe and new data from clients who have since granted permission.

