
DATA & INSIGHTS
Two populations set the pace. Pediatrics (patients under the age of 21) is concentrated in ENT and Dental and runs fast with predictable, high-throughput windows. Older adults (aged 61–80) dominate Ophthalmology, Orthopedics, and Total Joint, driving OR minutes, and in many centers, payments. Layer in a reliable Q4 lift and a rising Total Joint share, and a clear picture emerges of where cases, dollars, and OR time actually live.
Key Findings
Older patients drive the day.
Pediatrics is concentrated and predictable.
Minutes follow complexity.
Sex clarifies the “who.”
Q4 still matters.
Cases, Payments, and OR Minutes by Specialty
Case Share by Specialty
Demand remains diversified with a reliable Q4 lift. Short-turn specialties (GI, Ophthalmology, ENT) anchor case volume, while Orthopedics and Spine contribute a smaller but meaningful share. Expect a repeatable late-Q4 uptick; that’s the period most likely to pressure rooms and finish times.
Which two specialties account for most of your case volume — and does that pair change in Q4?
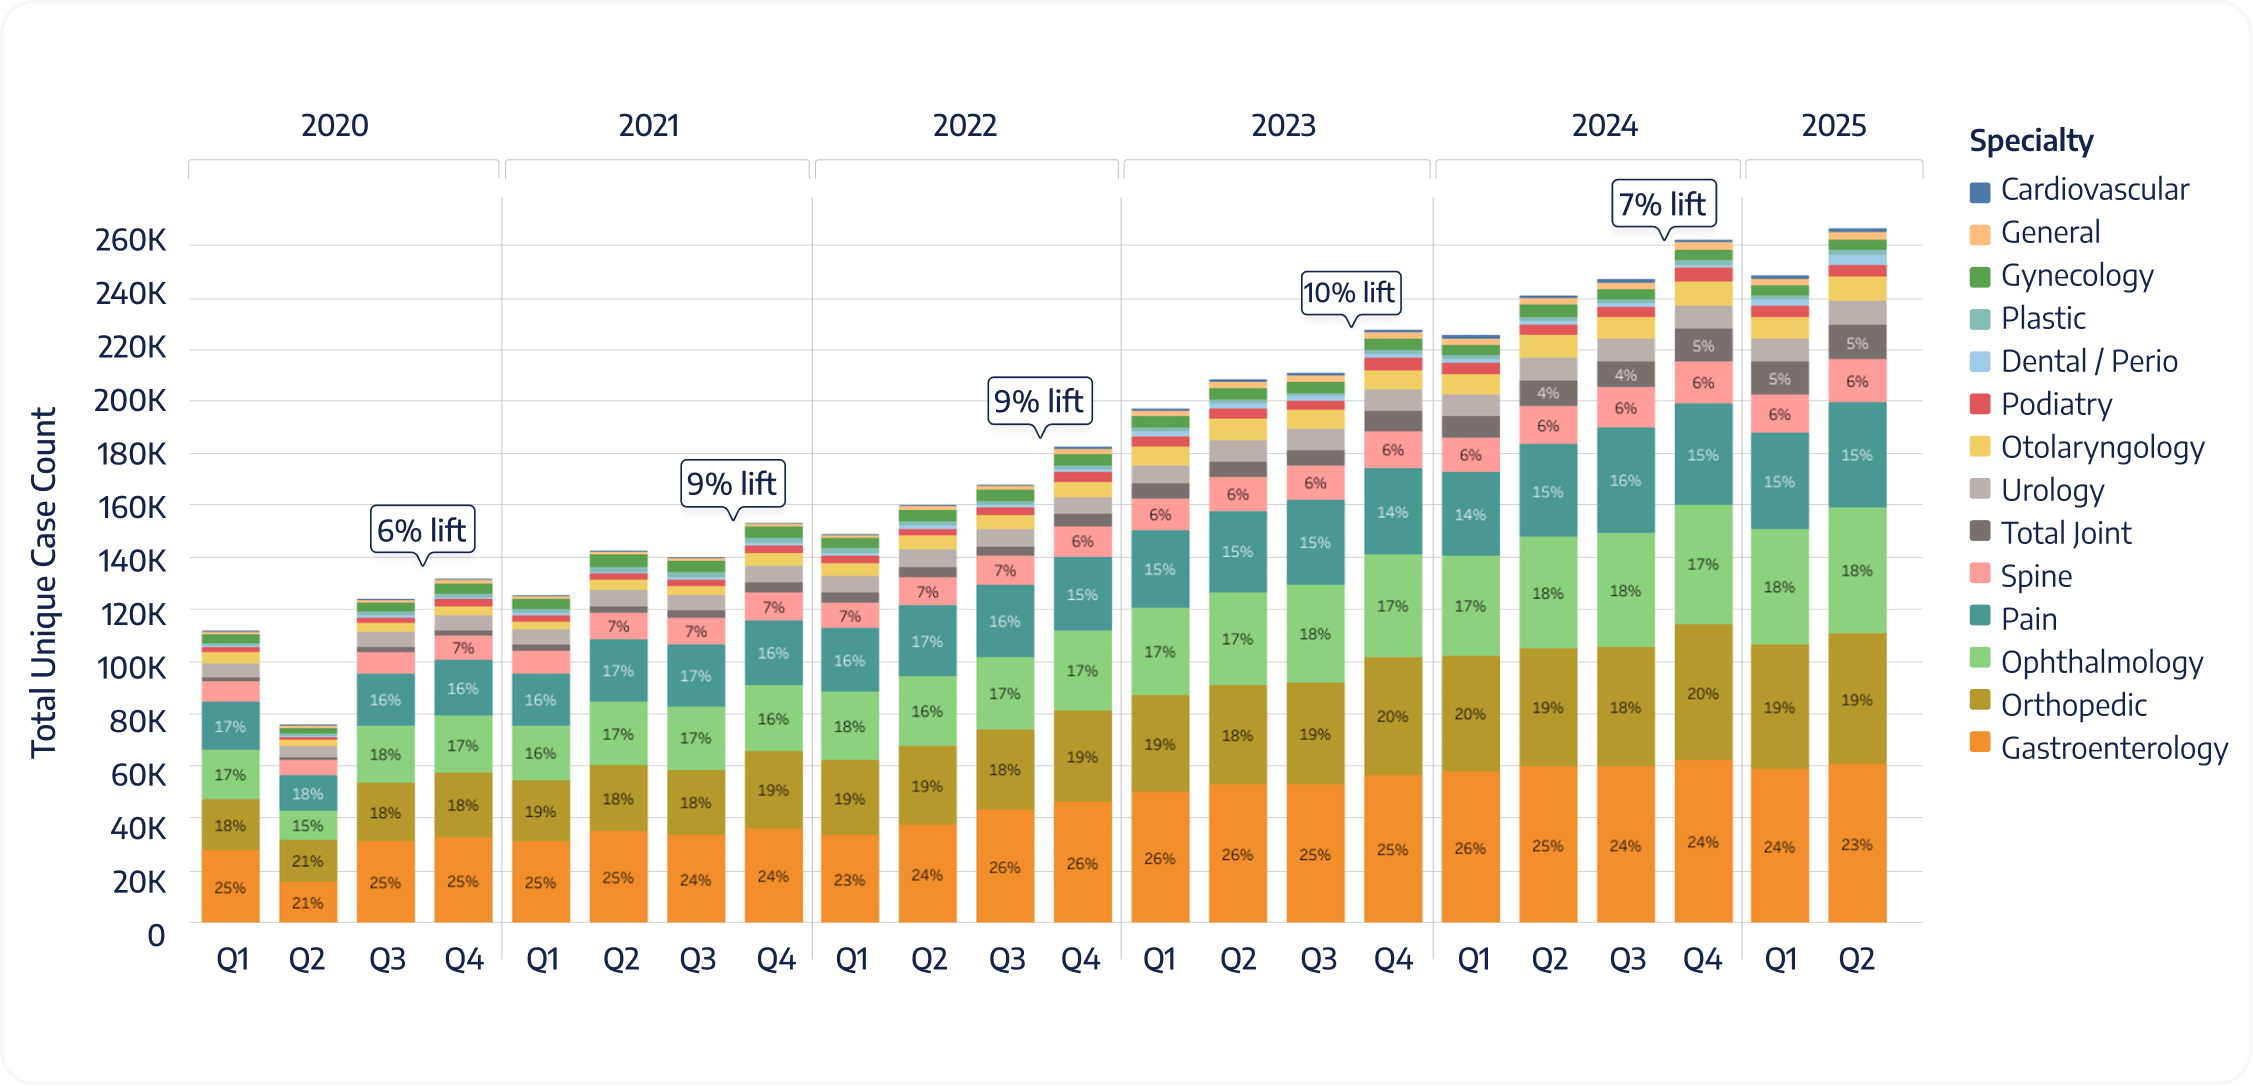
Percentage of Total Cases by Specialty from Q1 2020 to Q2 2025
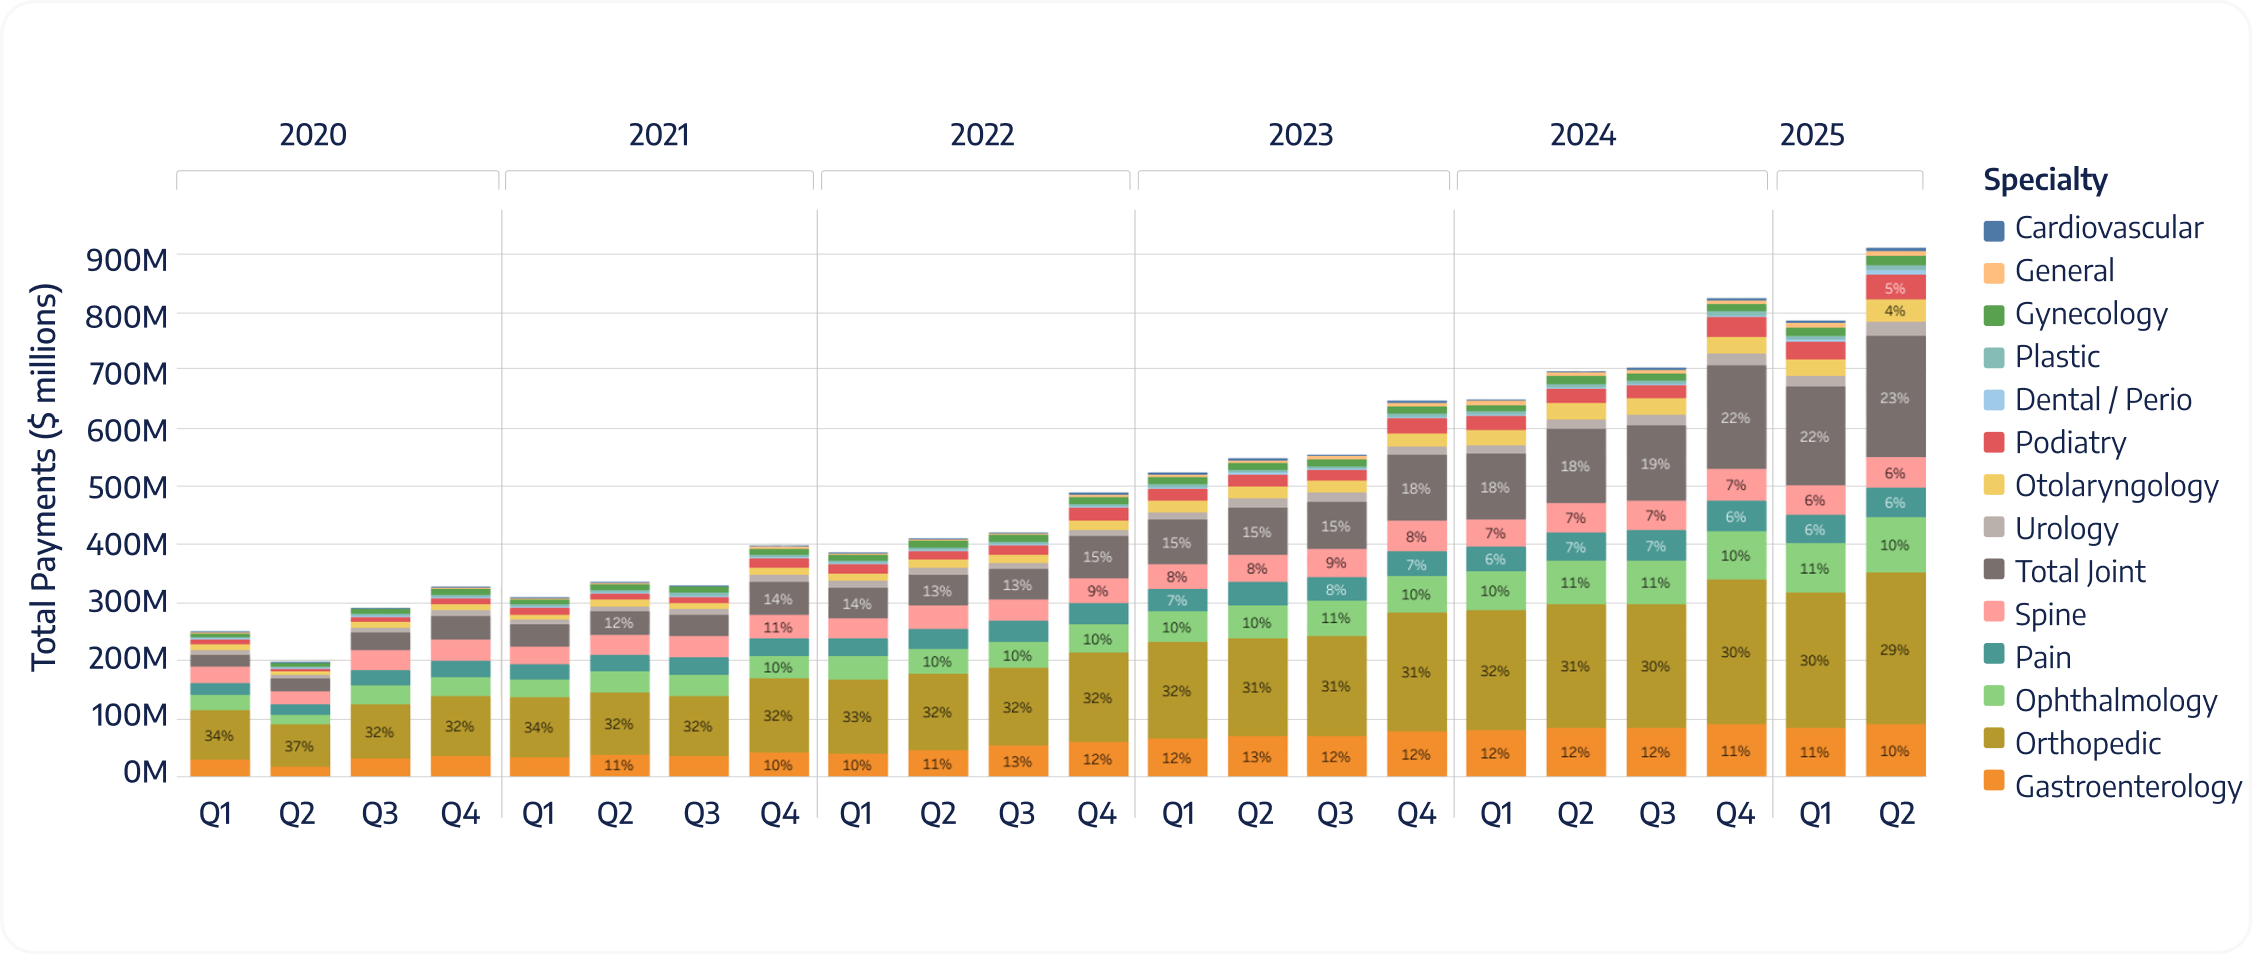
Percentage of Total Payments by Specialty from Q1 2020 to Q2 2025
Percentage of Total Payments by Specialty from Q1 2020 to Q2 2025
Has Total Joint payment share increased since 2023 at your center?
Do your five longest specialties account for ~80% of total minutes?
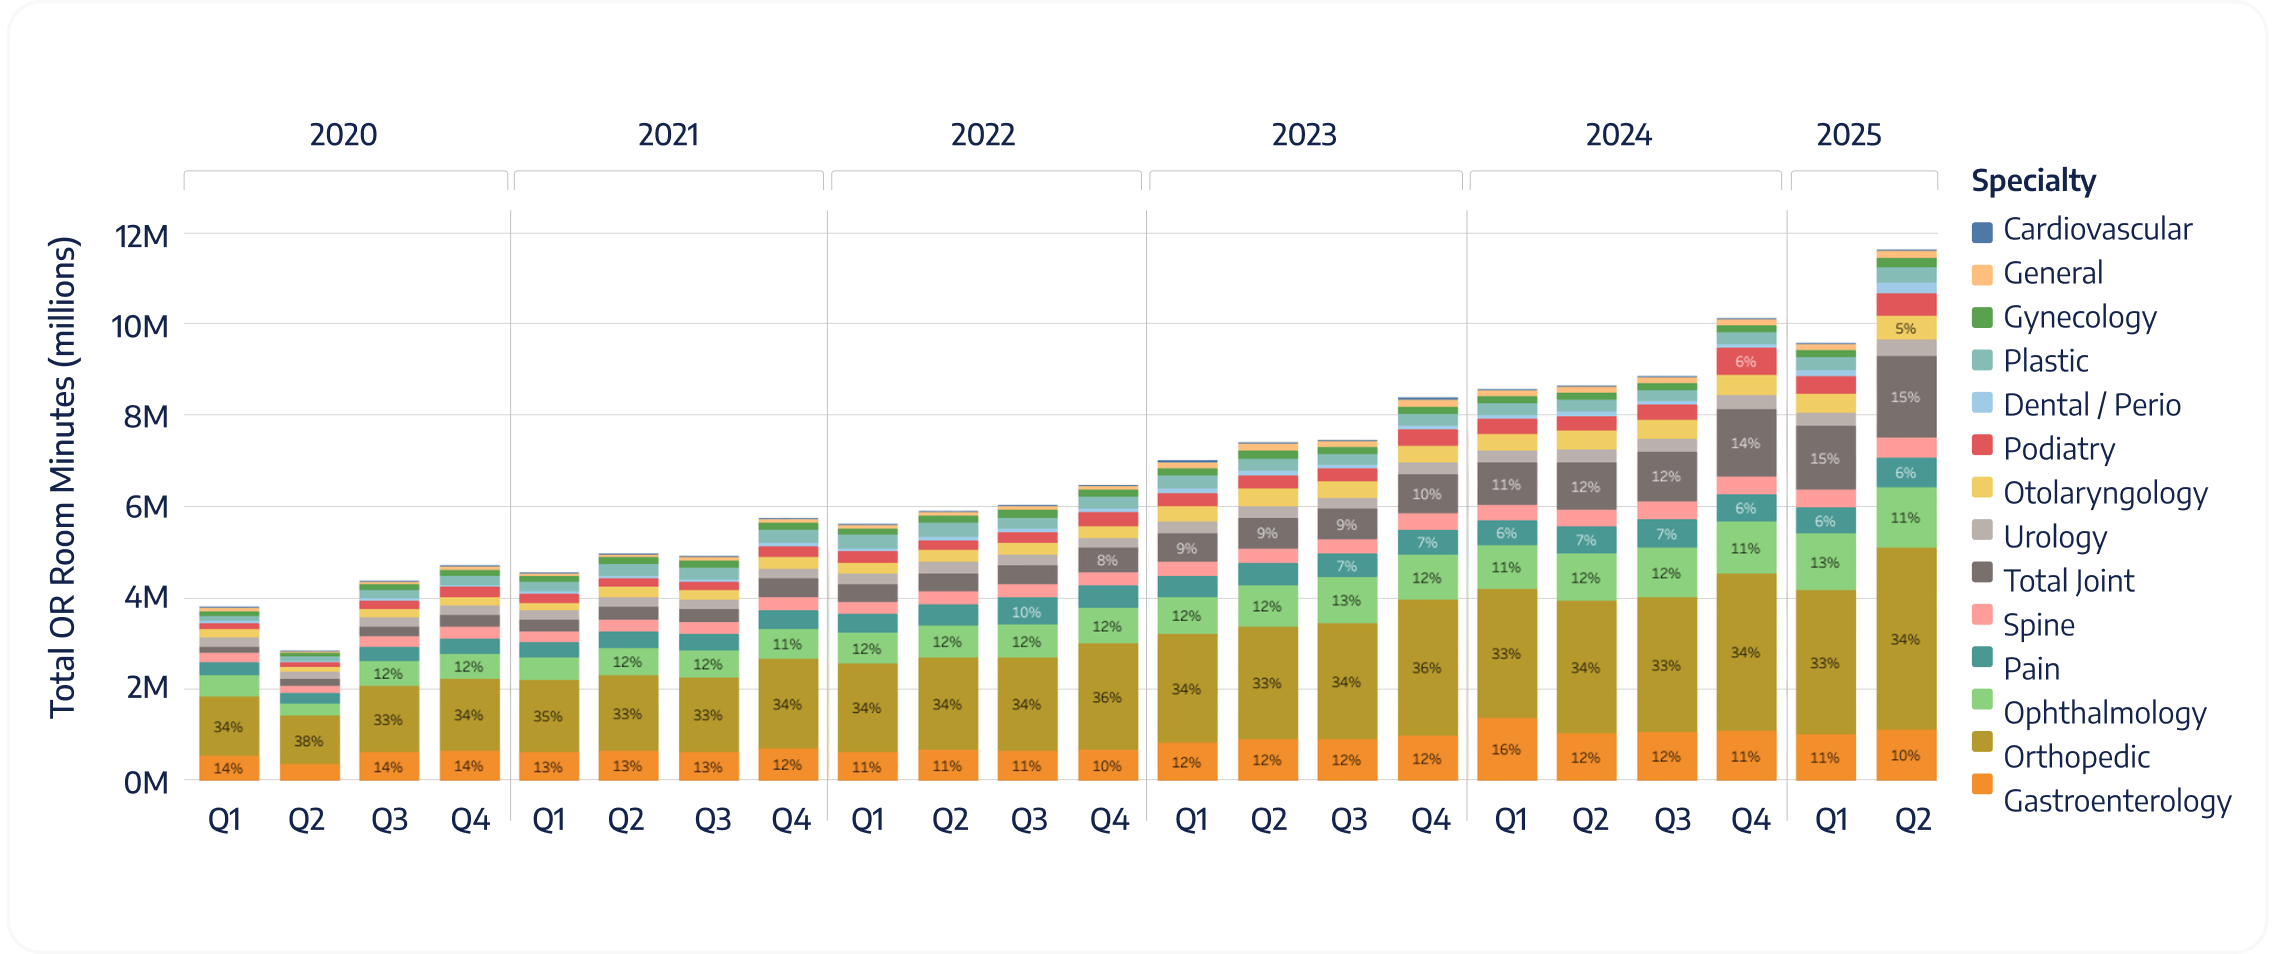
Percentage of Total OR Minutes by Specialty from Q1 2020 to Q2 2025
Age and Sex Distributions Across Specialties: A Closer Look at How Demographics Predict Cases, Payments, and OR Minutes
What share of your cases are aged 61–80: <30%, 30–40%, or >40%? And are cases for patients under the age of 21 <10% or ≥10% at your facility?
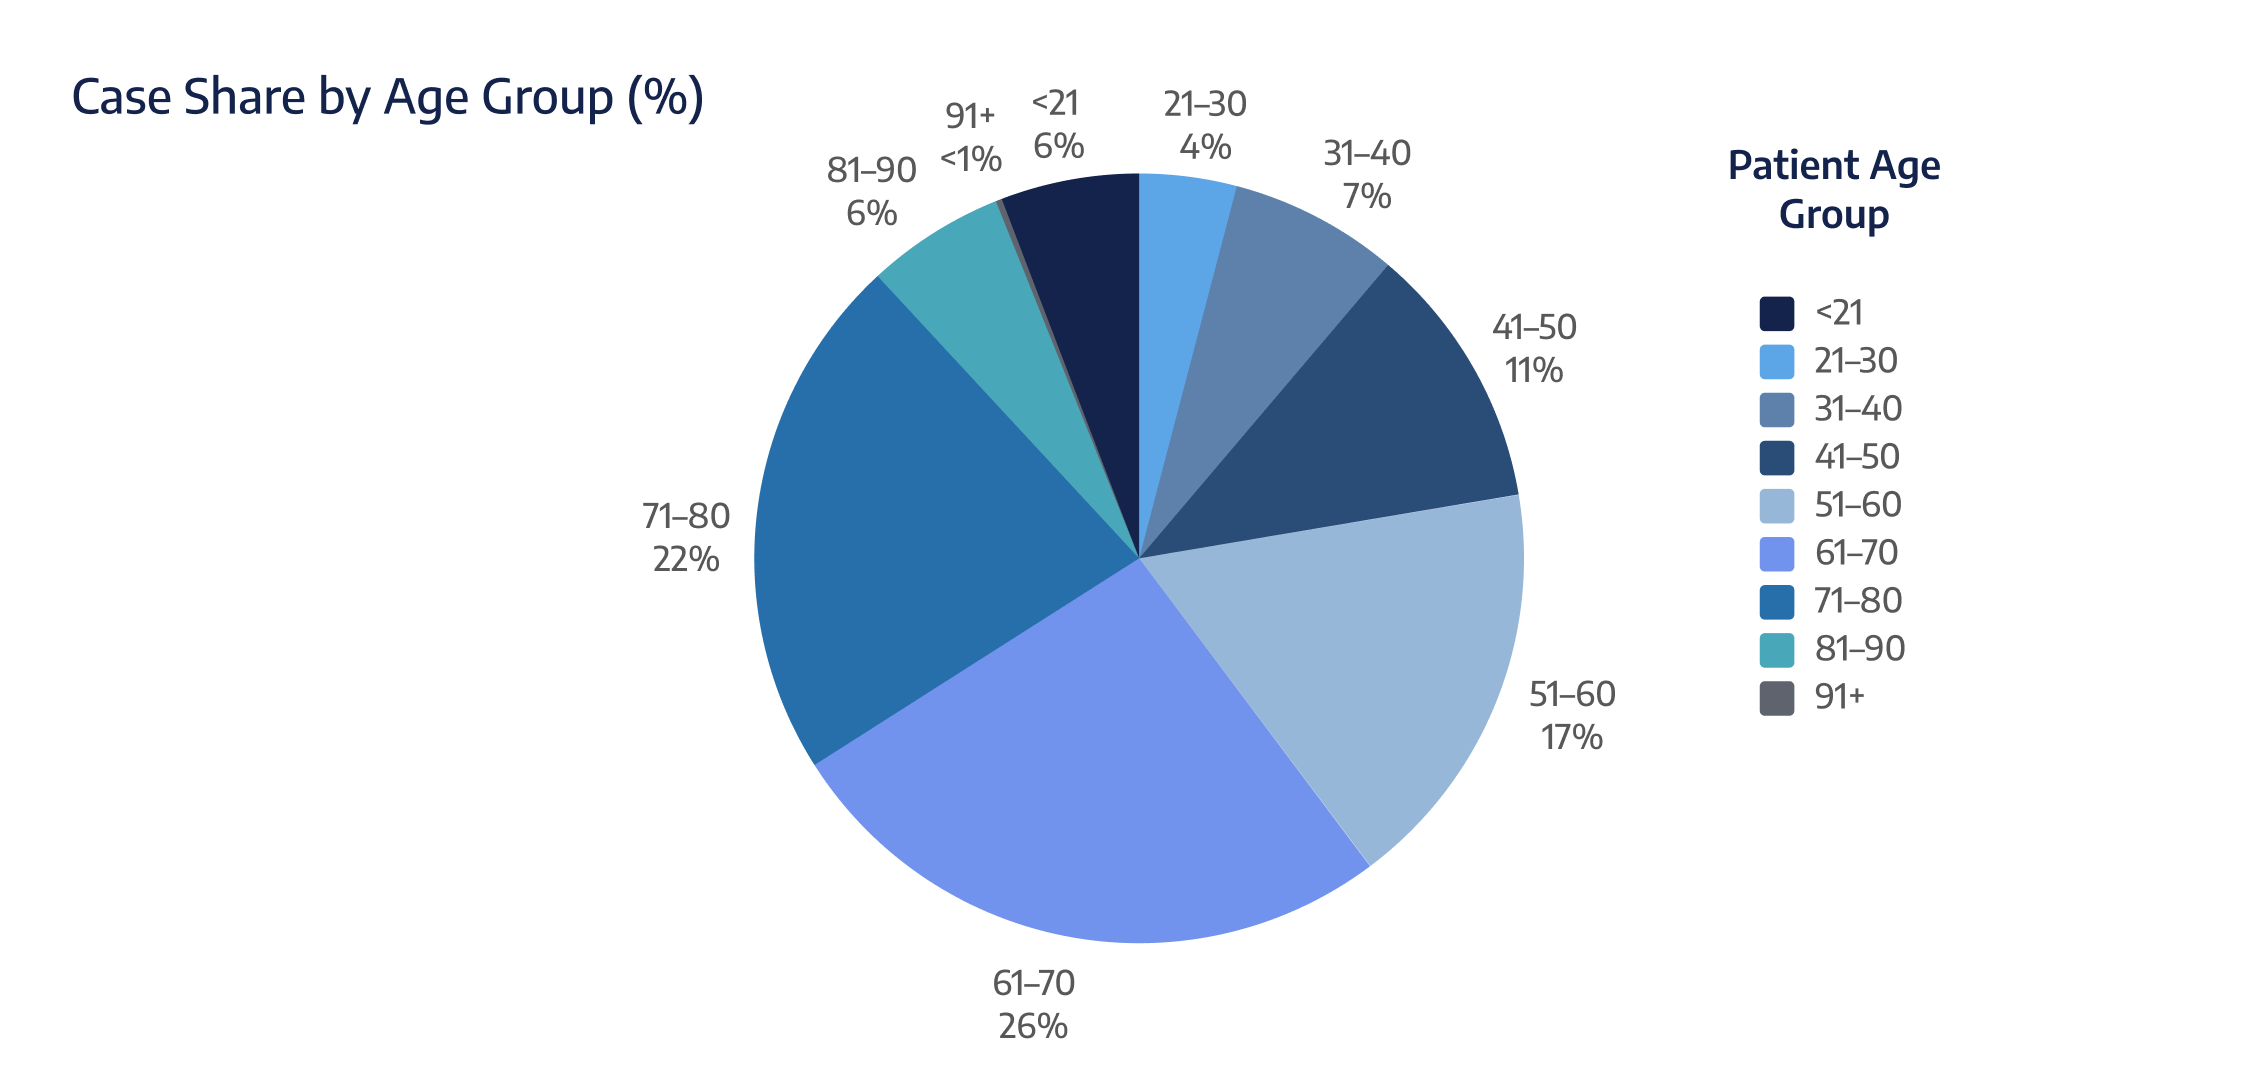
Percentage of Total Cases by Patient Age Group from Q1 2020 to Q2 2025
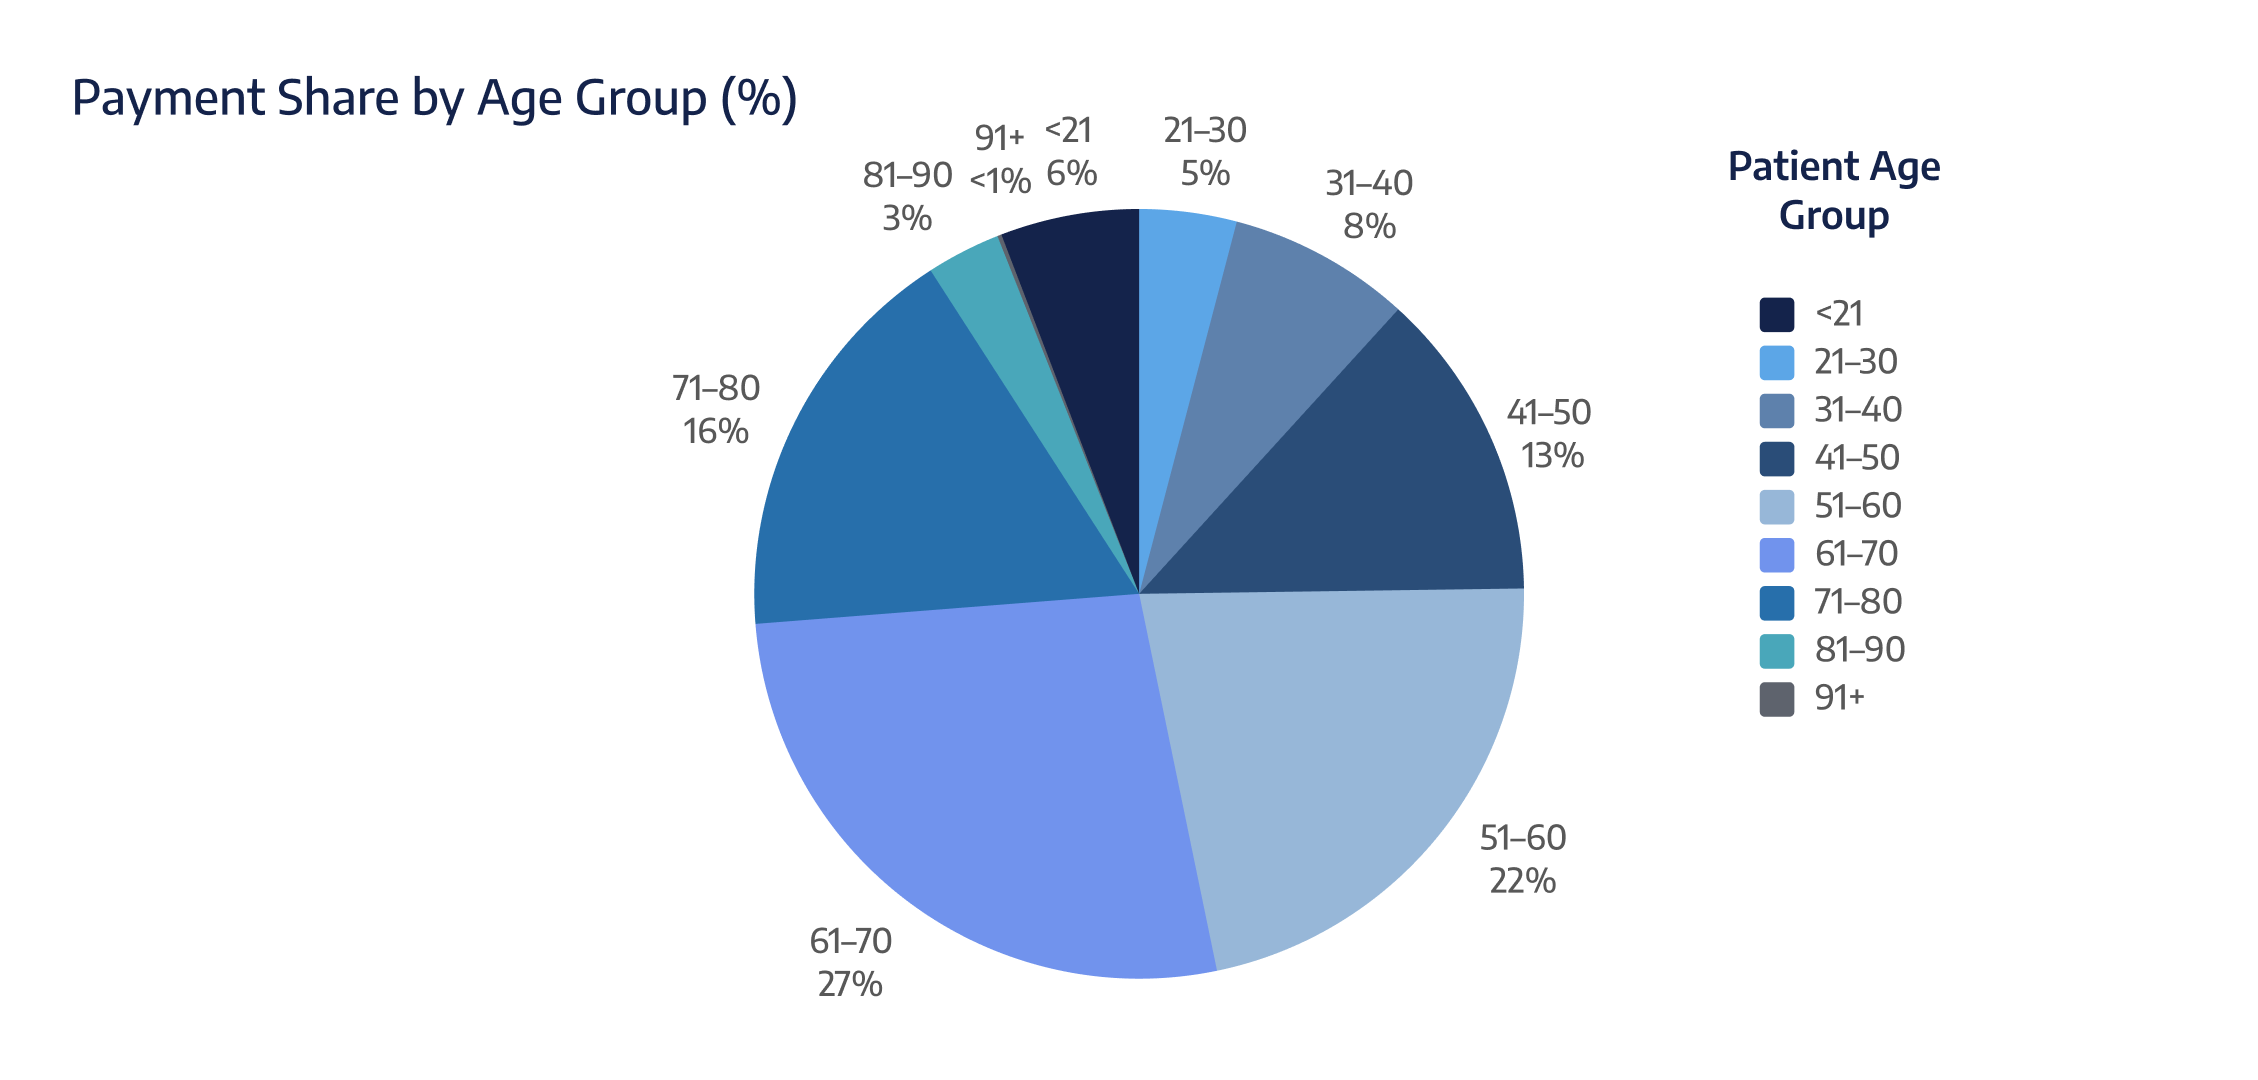
Percentage of Total Payments by Patient Age Group from Q1 2020 to Q2 2025
Is your payment share for 61–80 rising, stable, or falling year-over-year?
What percentage of OR minutes is attributed to patients aged 61–80 right now?
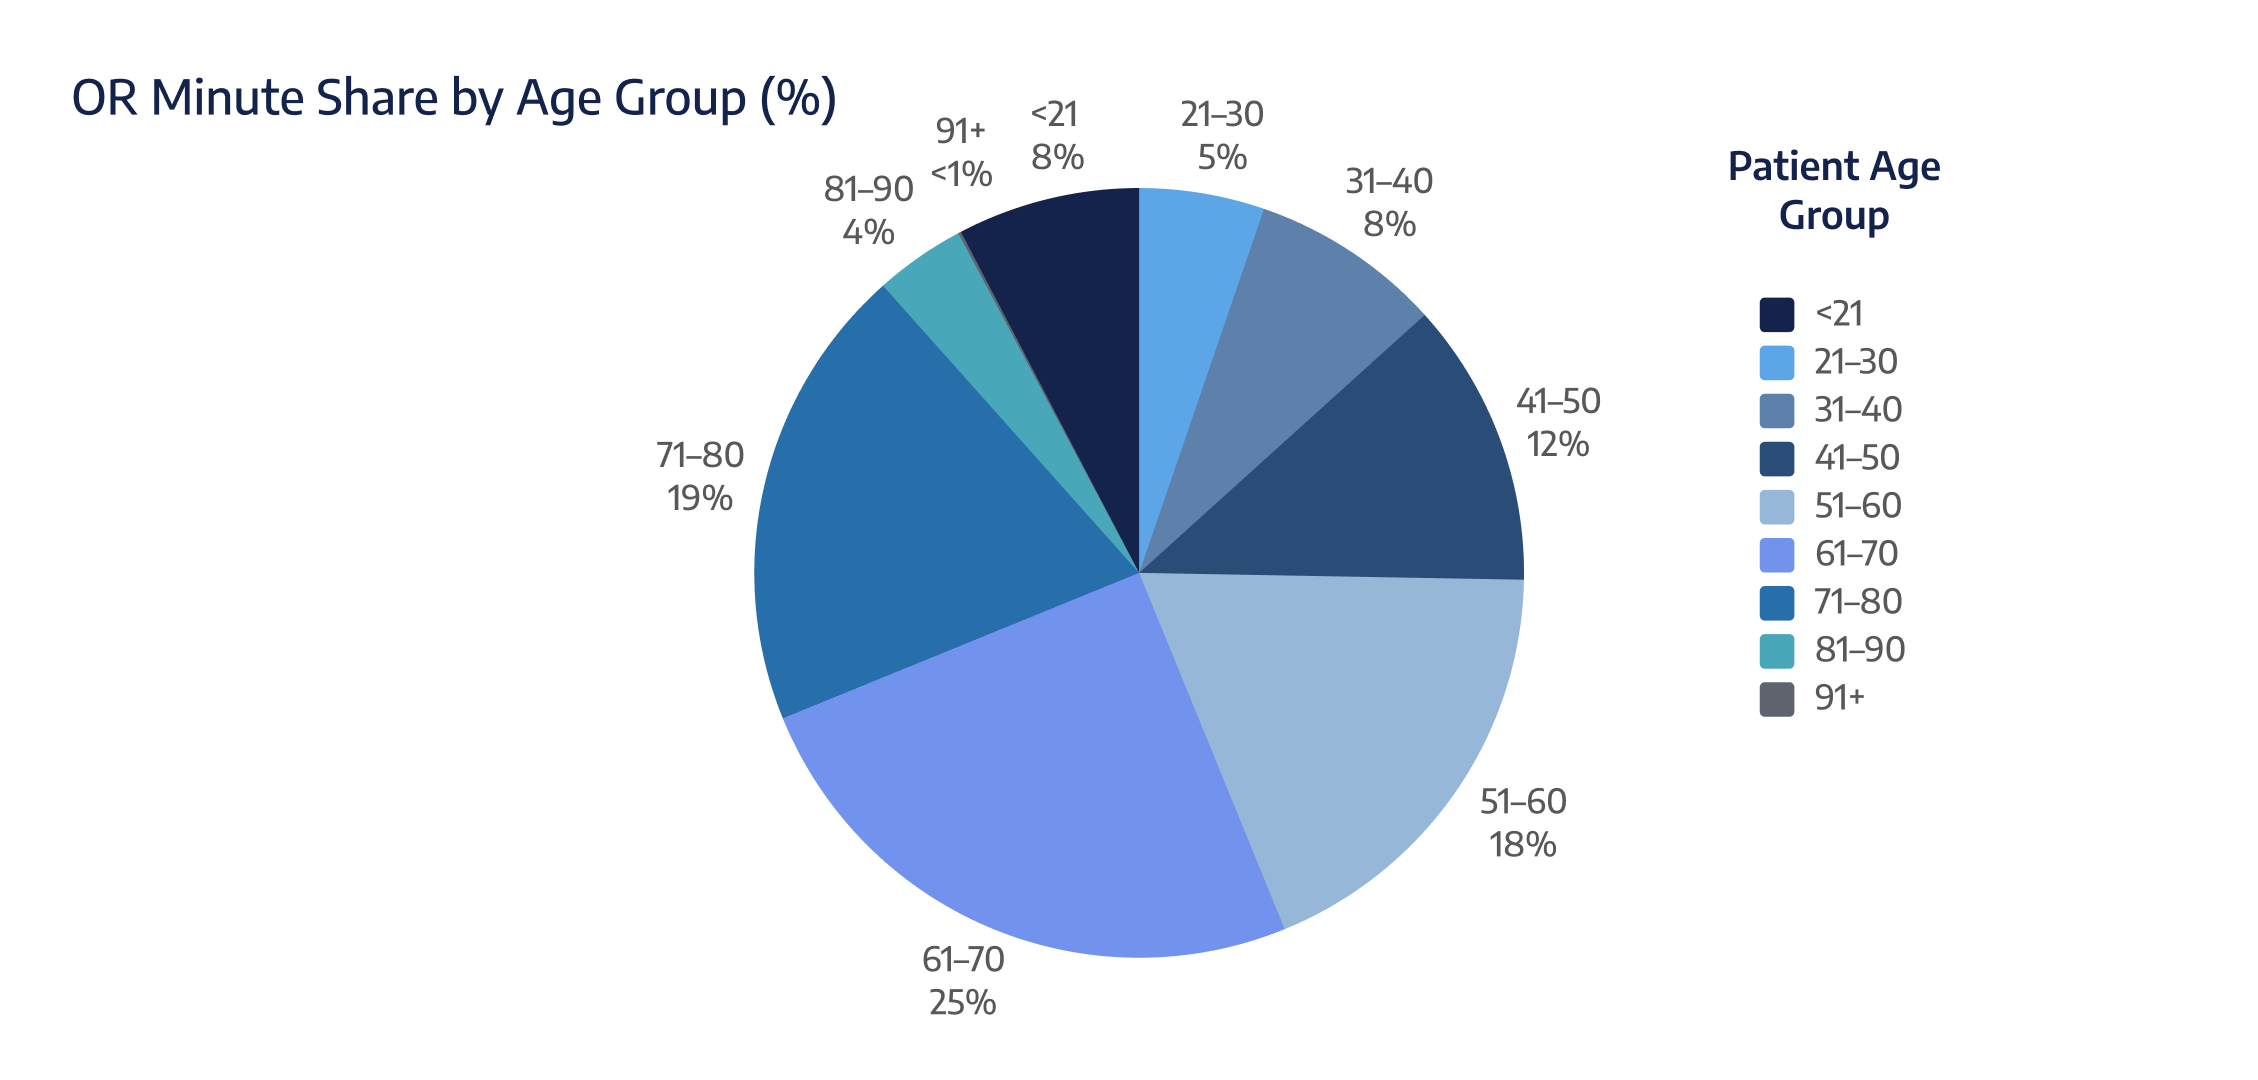
Percentage of Total OR Minutes by Patient Age Group from Q1 2020 to Q2 2025

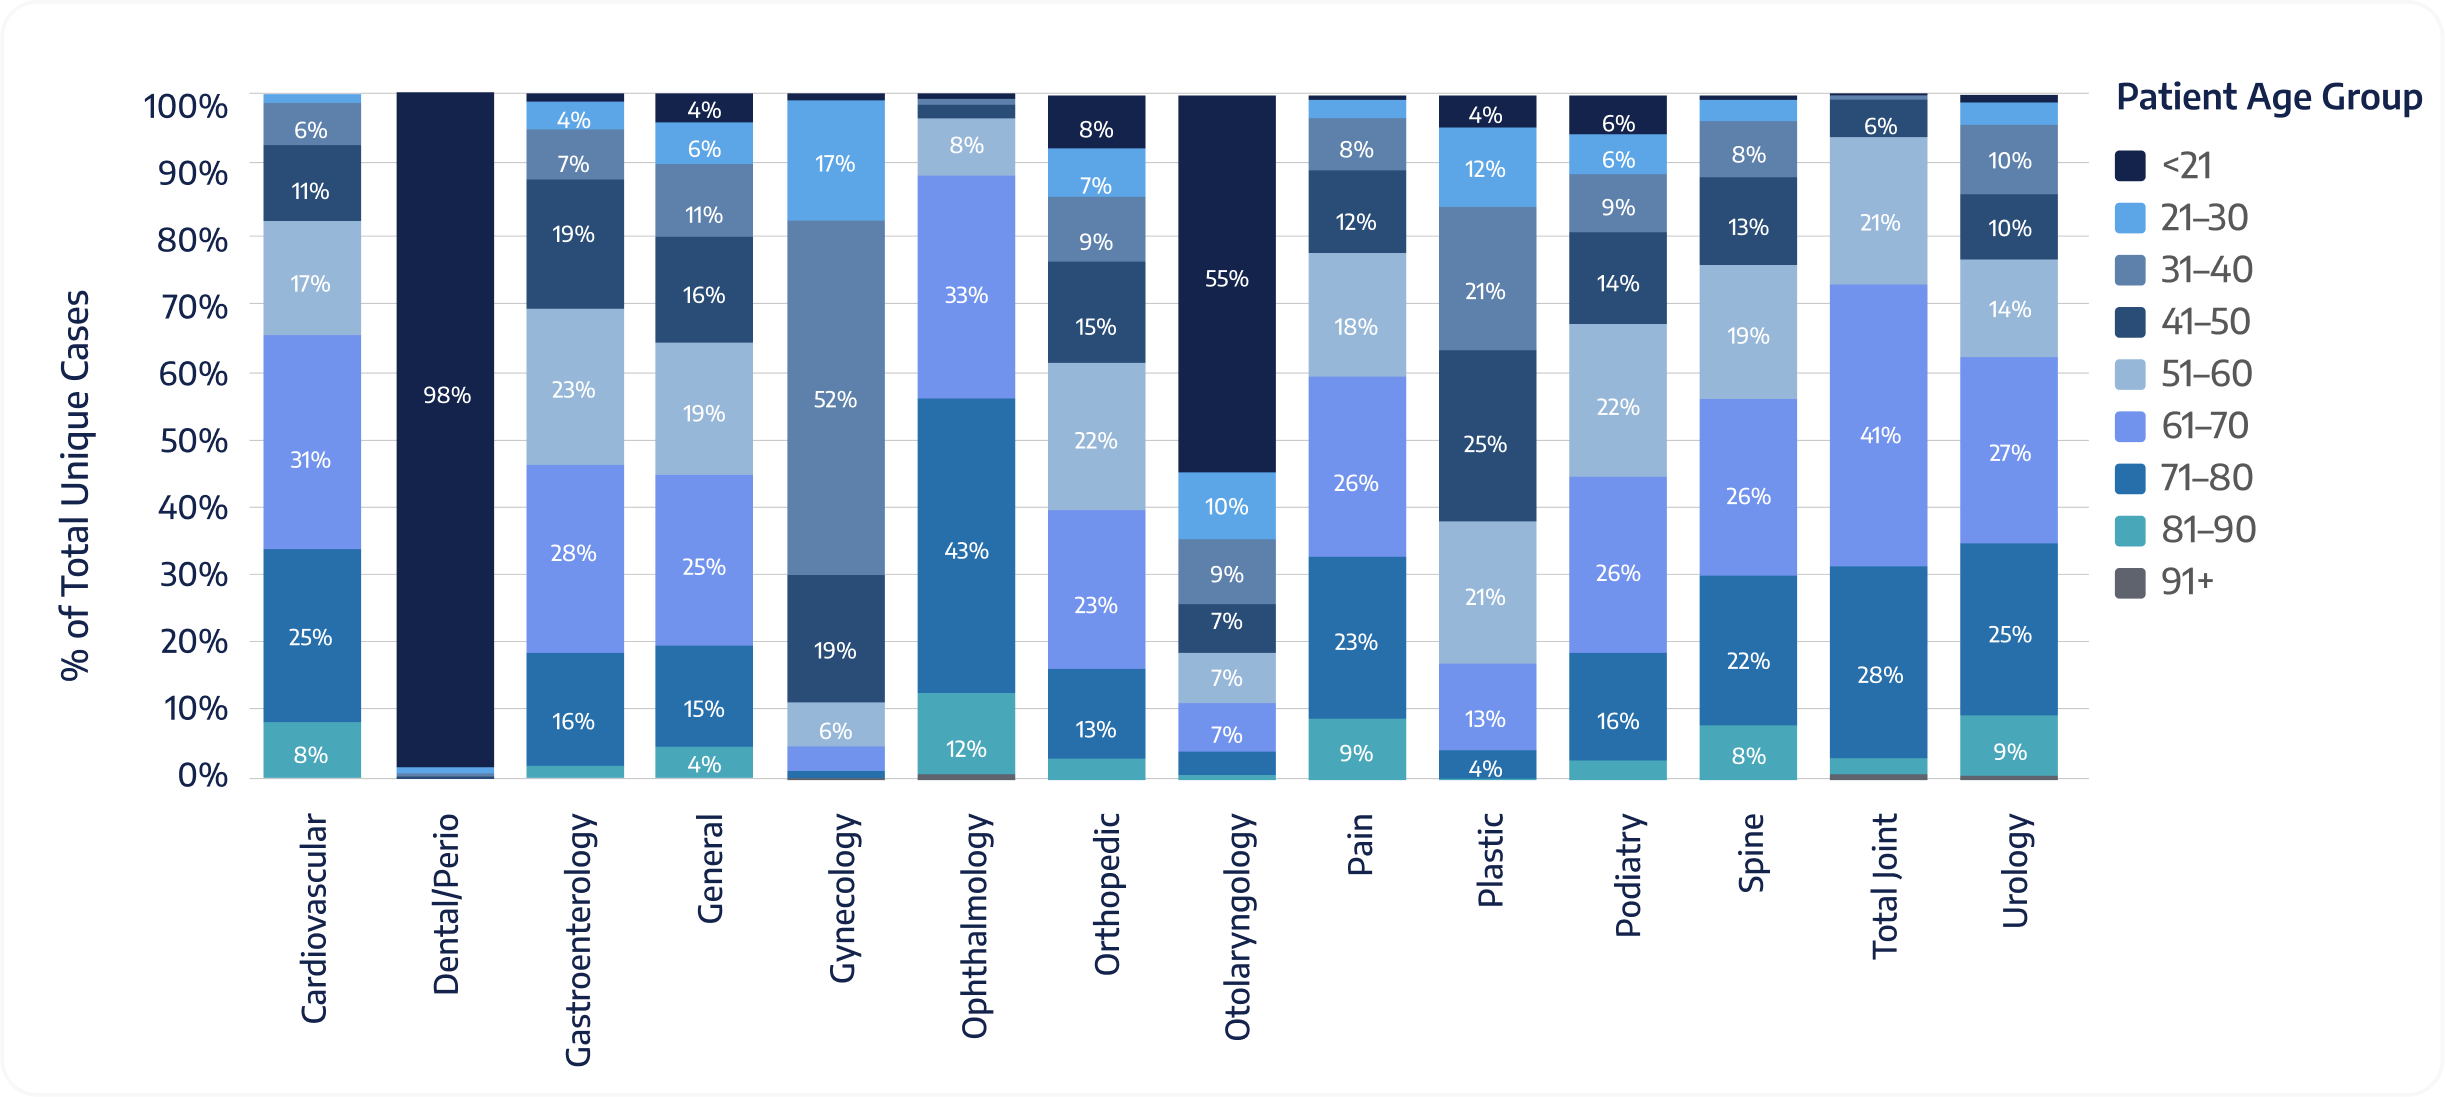
Percentage of Total Cases by Age and Specialty from Q1 2020 to Q2 2025
What percentage of your ENT and Dental cases are patients under the age of 21?
In Orthopedics, does your share of payments for patients aged 61–80 exceed case share?
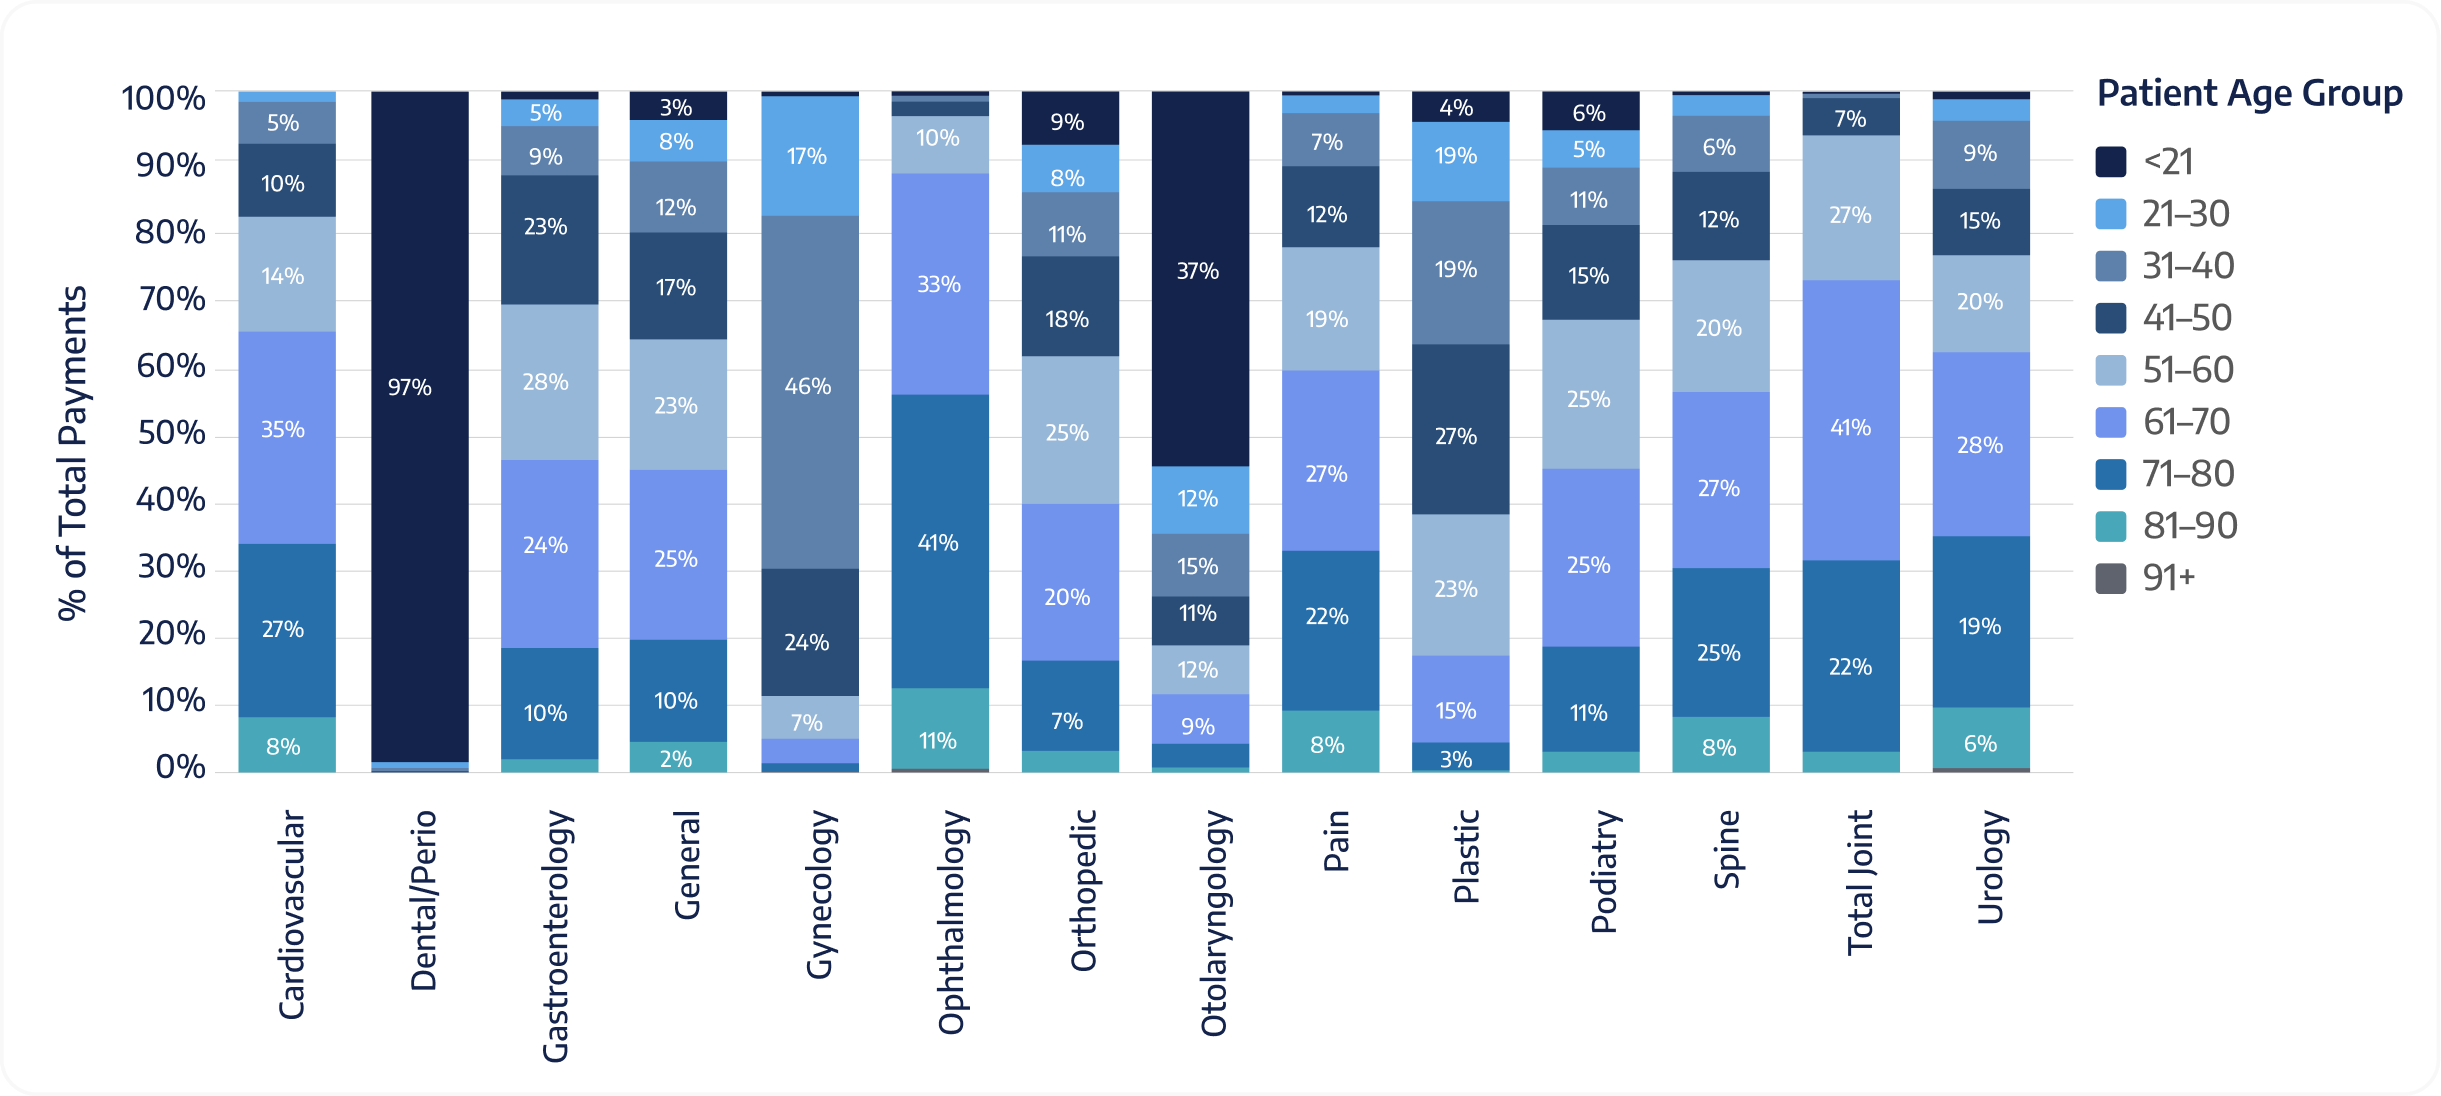
Percentage of Total Payments by Age and Specialty from Q1 2020 to Q2 2025
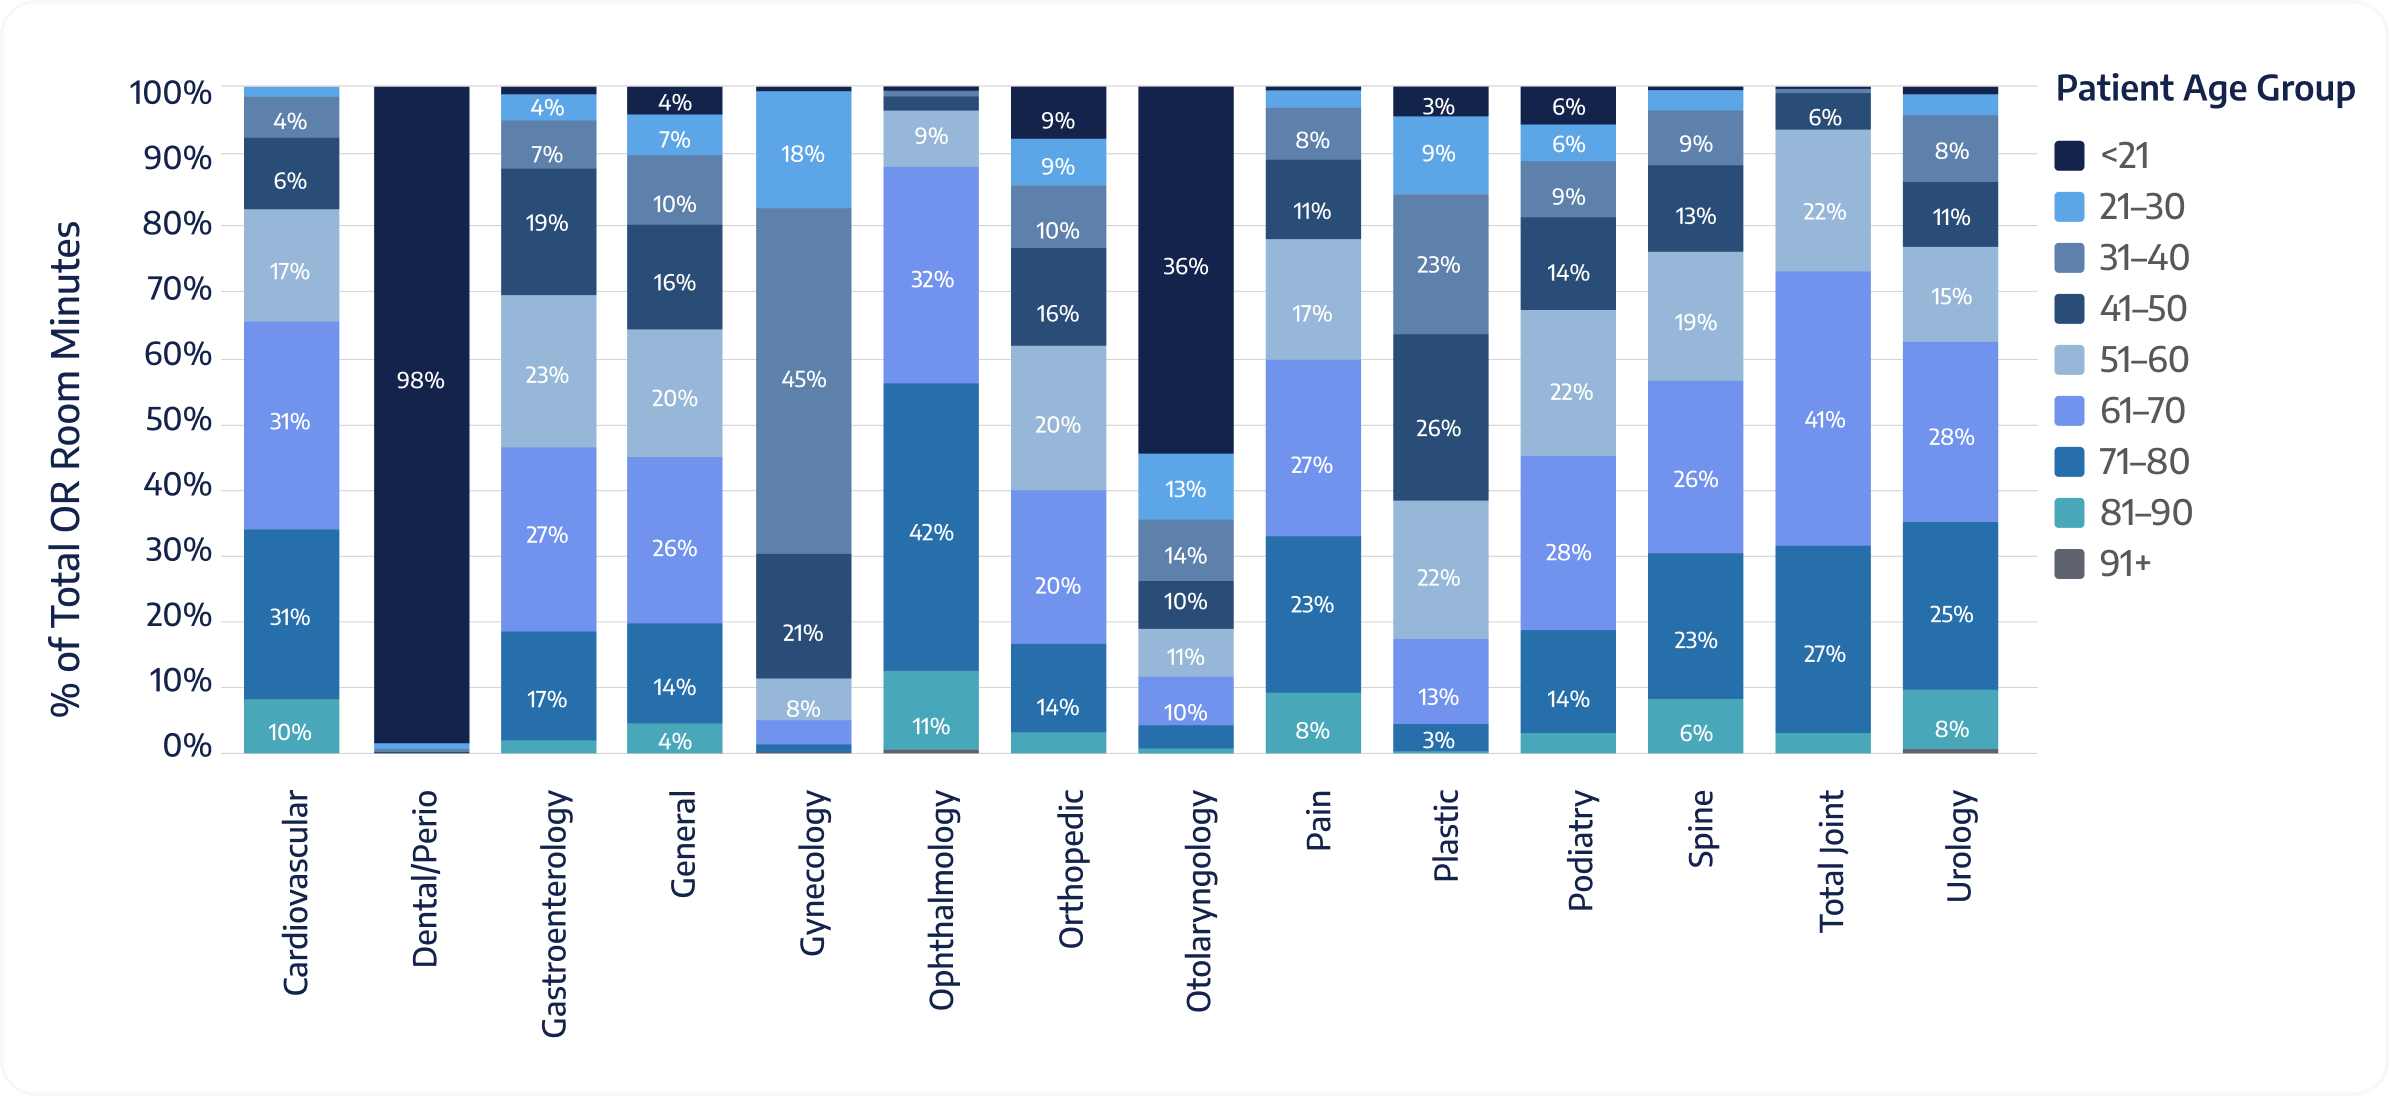
Percentage of Total OR Minutes by Age and Specialty from Q1 2020 to Q2 2025
In your Ortho slice, is OR-minute share for 61–80 higher than case share?
Sex distribution varies by specialty. Some are highly skewed (e.g., Gynecology is female-heavy, Urology is male-heavy), while others (Orthopedics, ENT, GI) are closer to balanced. This snapshot clarifies who you serve within each specialty and supports targeted outreach, messaging, and even the experience you offer inside your center.
In your top three specialties, is your case mix mostly female, mostly male, or balanced?
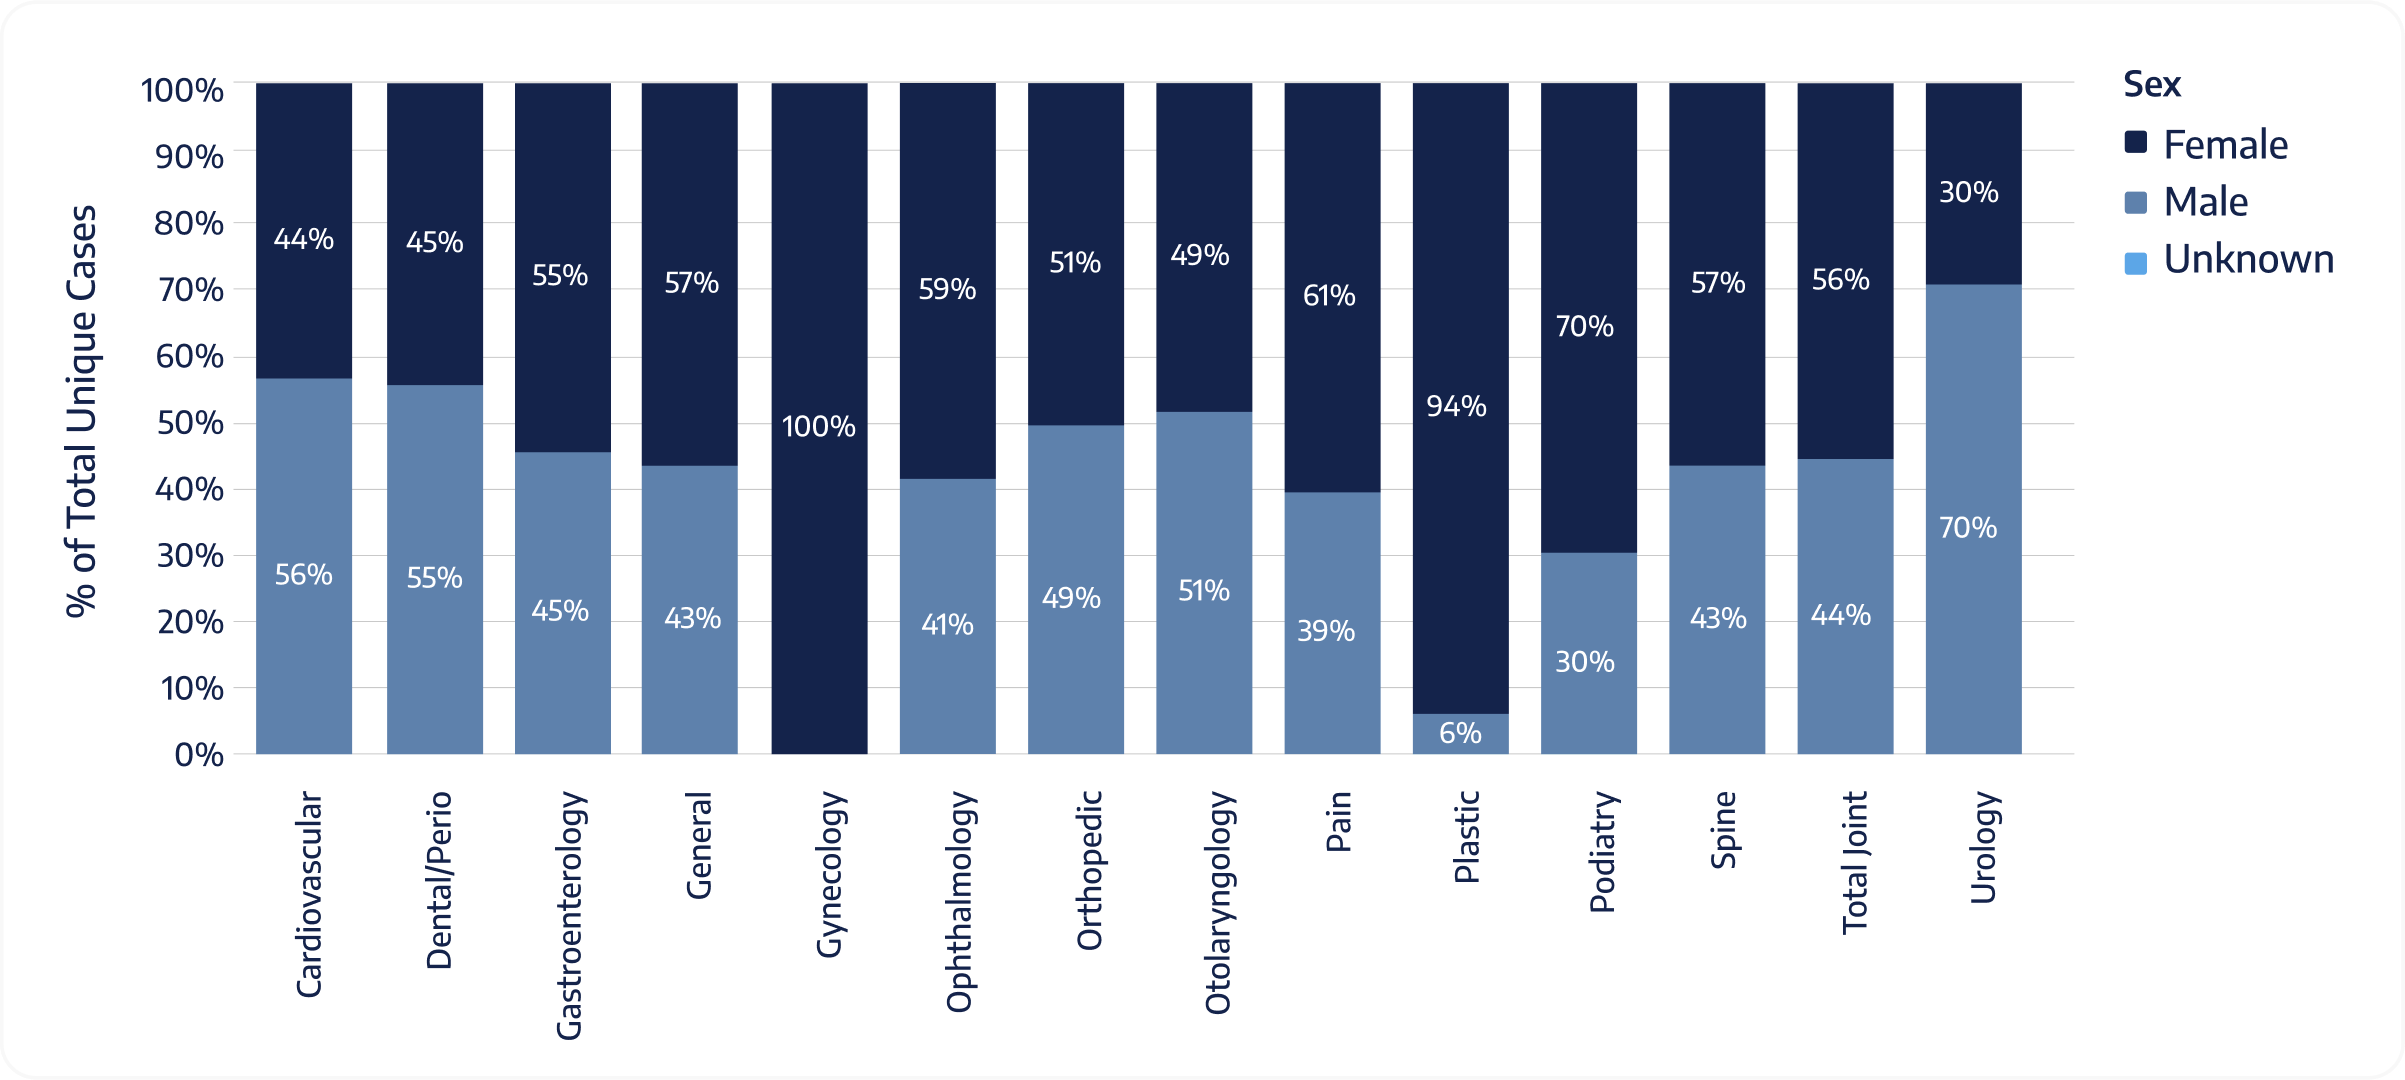
Percentage of Cases by Sex and Specialty from Q1 2020 to Q2 2025
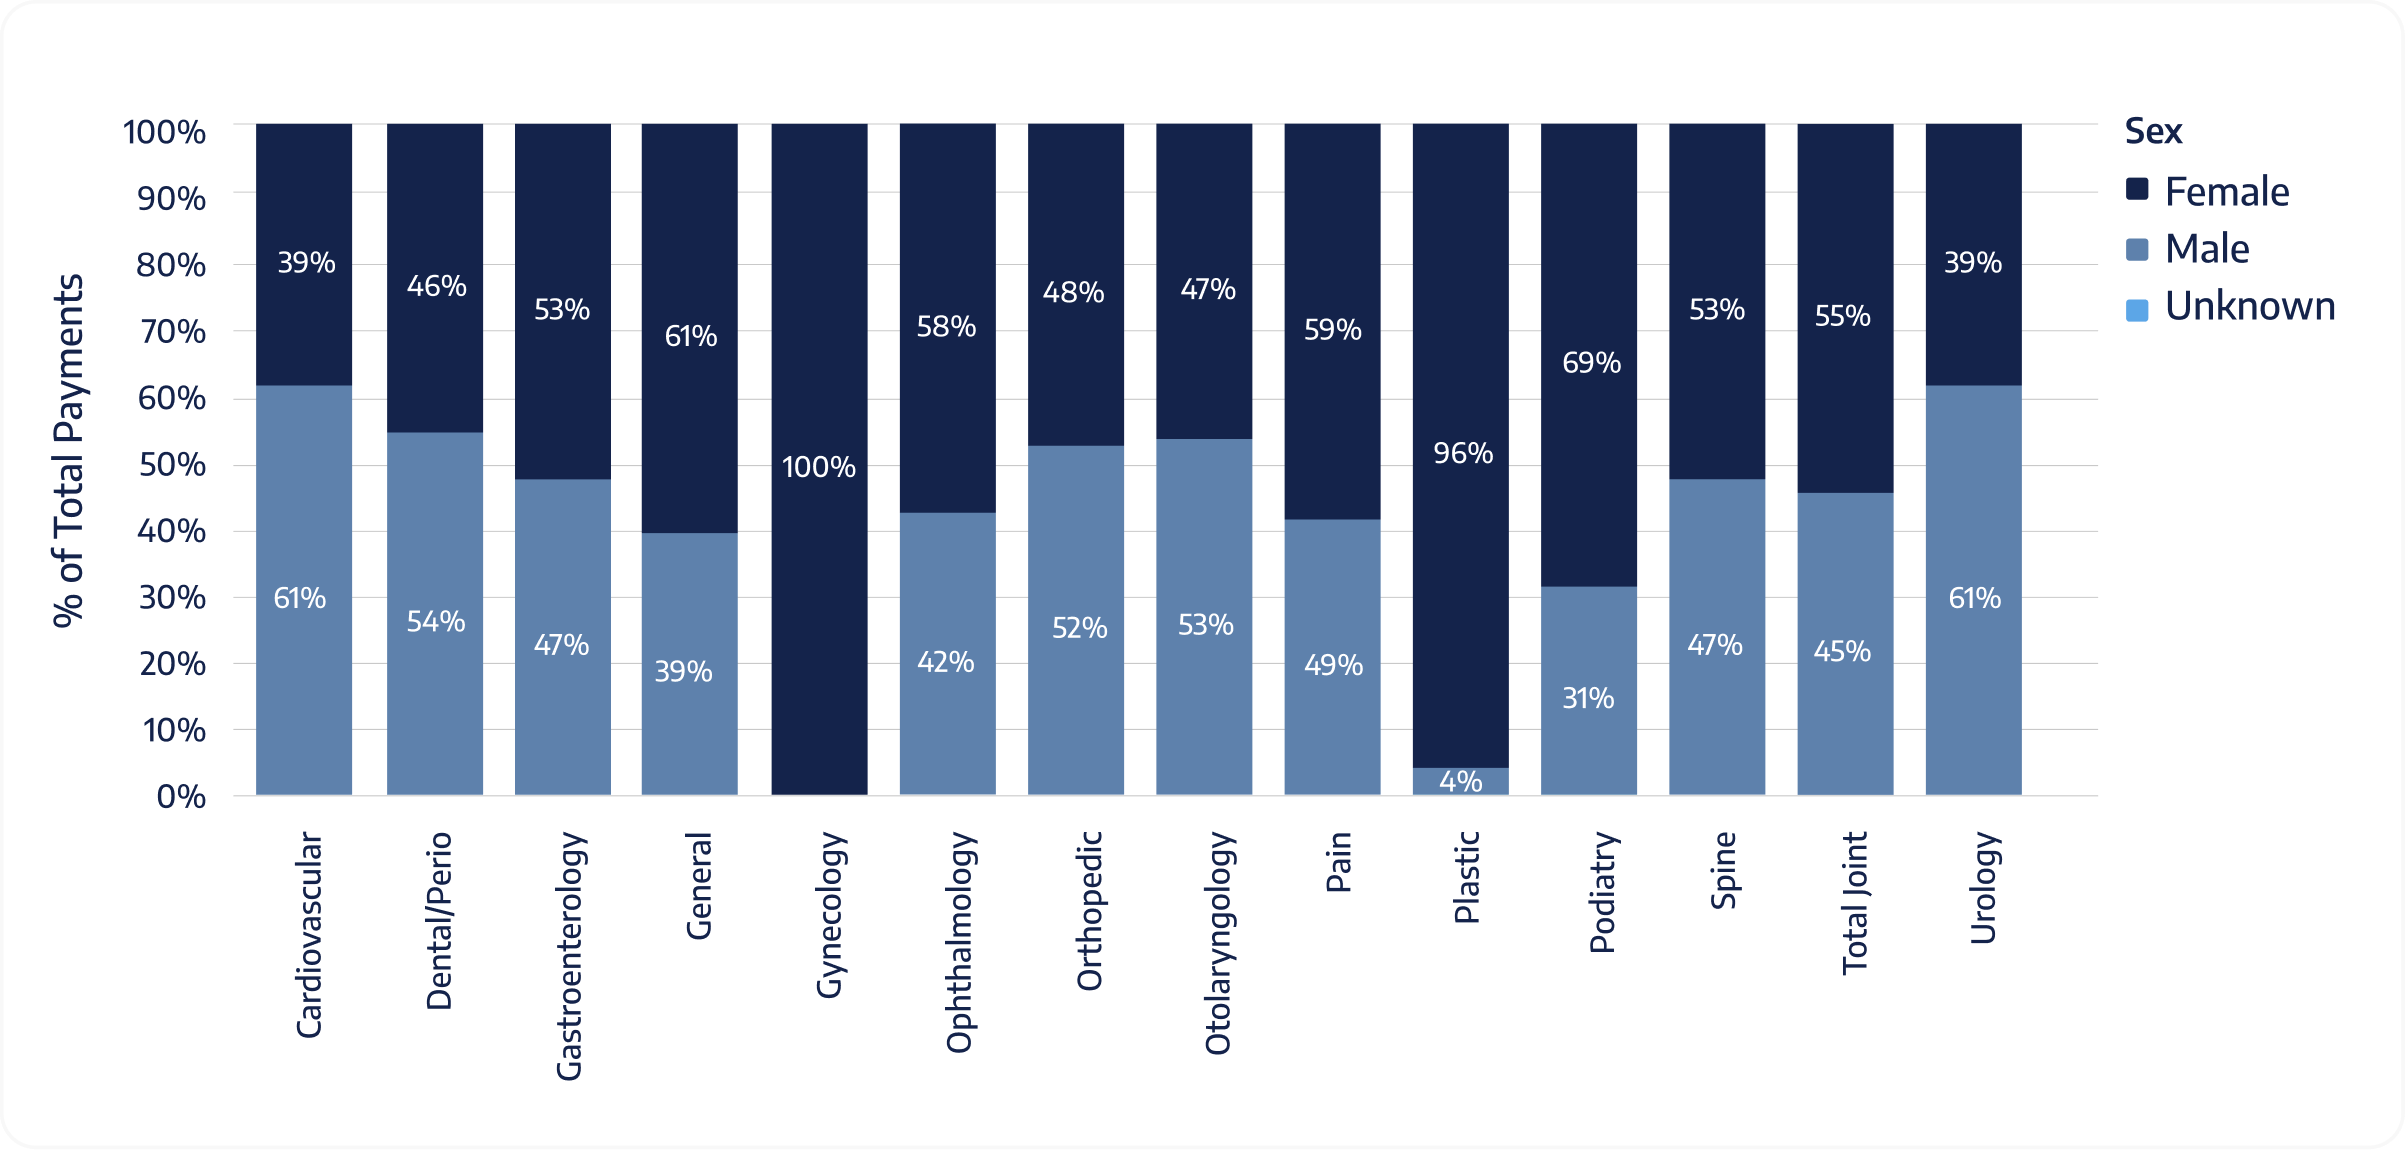
Percentage of Payments by Sex and Specialty from Q1 2020 to Q2 2025
In your top specialties, is payment share for each sex lower / same / higher than their case share?
OR Minute Share by Sex and Specialty
In your top-minute specialty, is OR-minute share for each sex lower / same / higher than their case share?
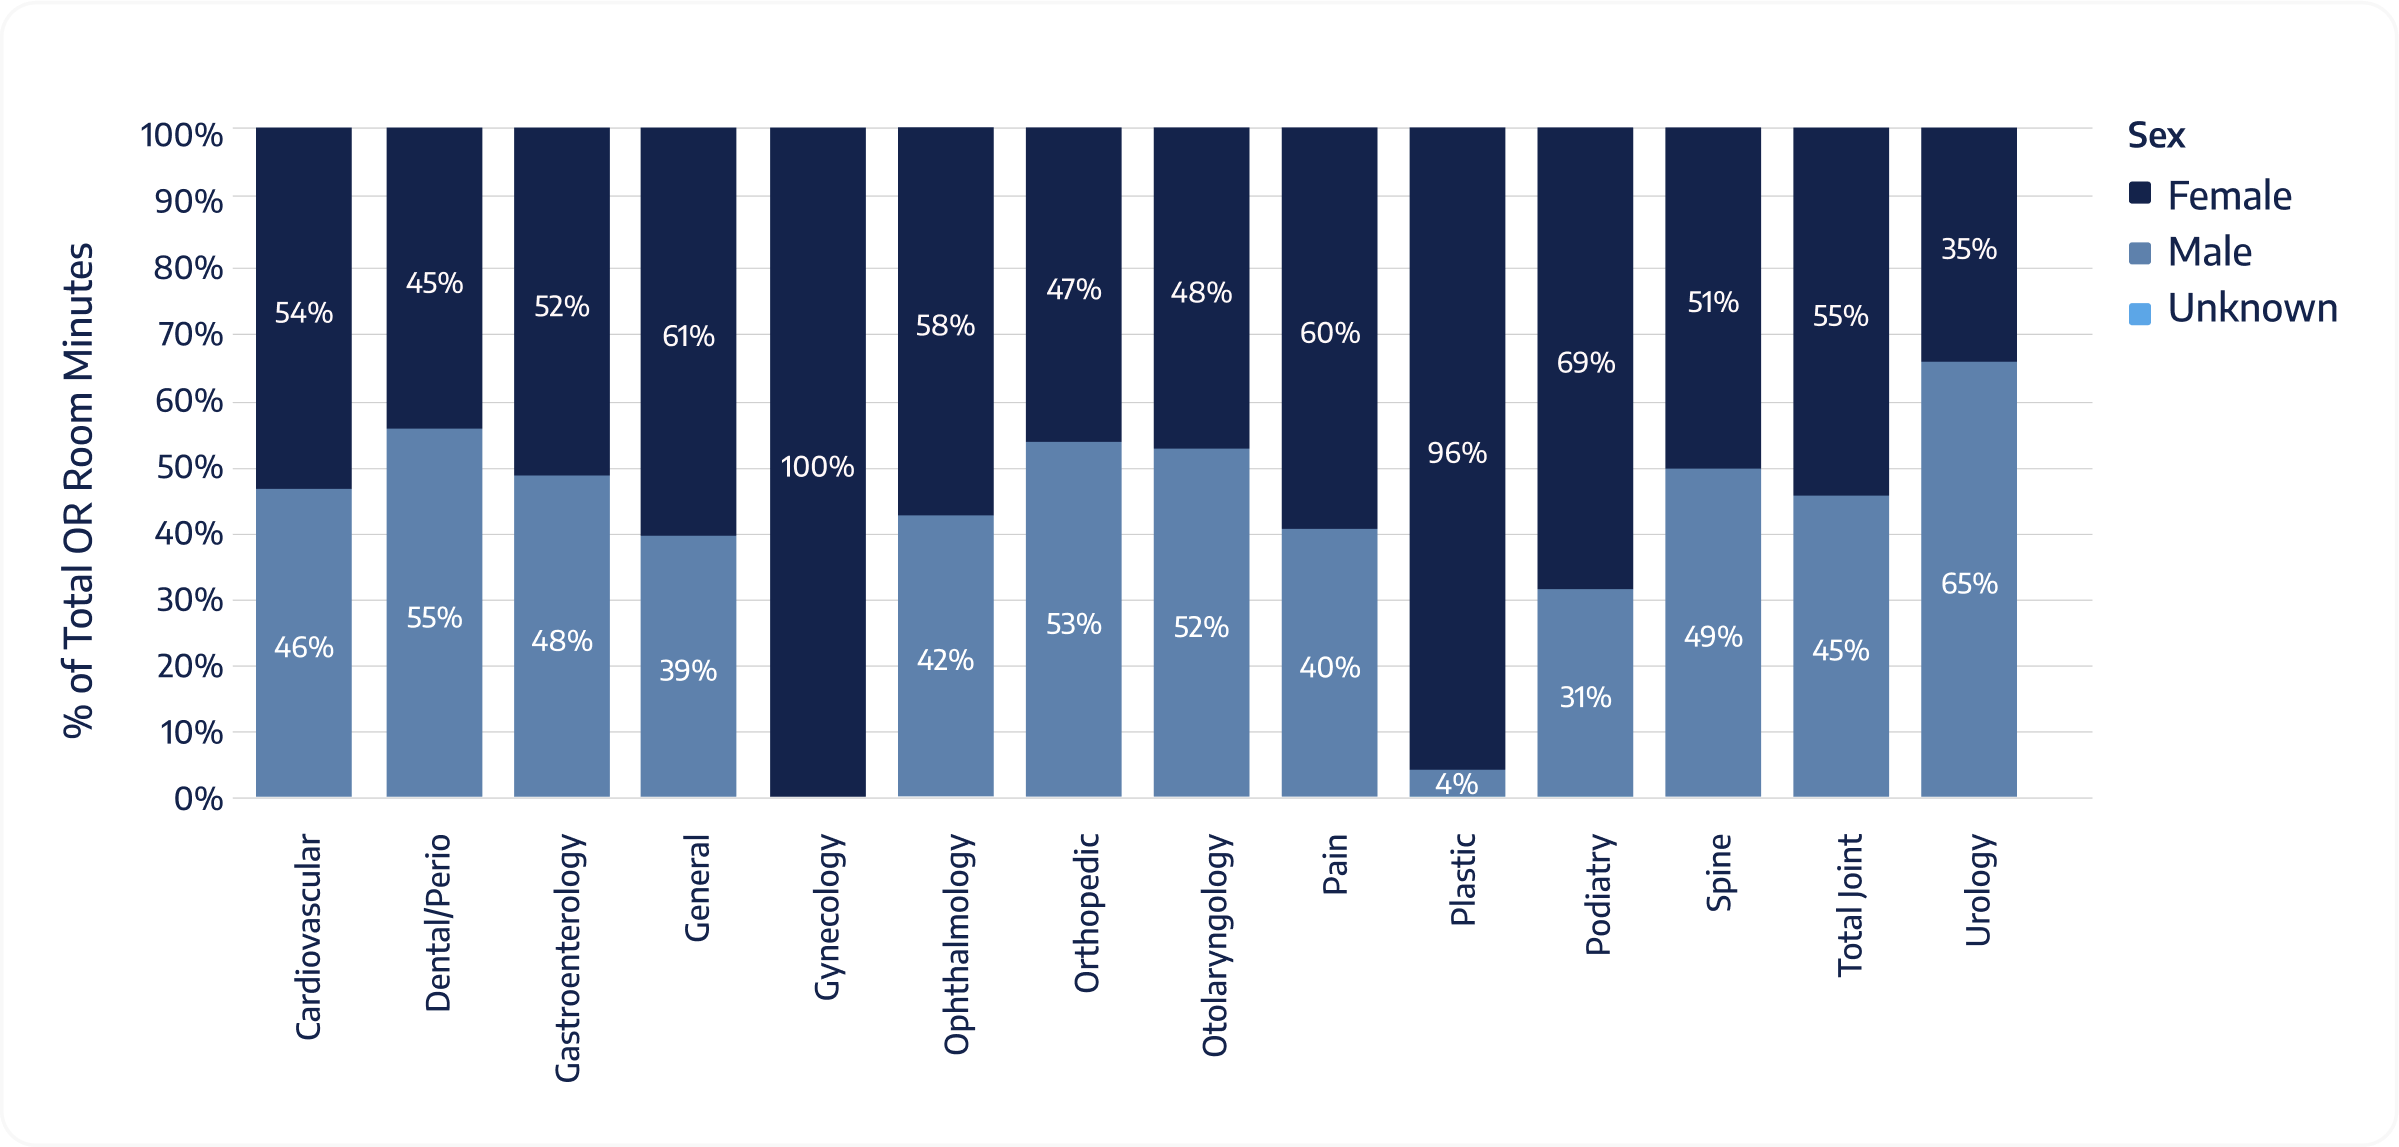
Percentage of OR Minutes by Sex and Specialty from Q1 2020 to Q2 2025
5 Key Benchmarks to Track
-
1Age Load% of OR minutes from patients aged 61–80
-
2Kids’ Footprint% of ENT and Dental cases that are under the age of 21
-
3Joint Momentum% of Orthopedics attributable to Total Joint (use payments or minutes consistently)
-
4OR Minute-Case Gap by SexGap = OR-minute % − case % for the dominant sex in your top-minute specialty (Positive gap = longer/more complex procedures for that sex in that specialty)
-
5Q4 Peak CheckIs there a significant Q4 case lift vs. your annual average?
Specialty Benchmarks at a Glance
| SPECIALTY | PRIMARY POPULATION SIGNAL | MINUTE PROFILE | Sex Distribution | MOST USEFUL CHECKPOINTS |
|---|---|---|---|---|
 Orthopedics and Total Joint
|
Older adults (61–80) | Long-minute | Often balanced | Age Load, Joint Momentum, OR Minute-Case Gap by Sex |
 Ophthalmology
|
Older adults | Short-turn, high throughput | Often balanced | Age Load, OR Minute-Case Gap by Sex |
 Gastroenterology and Endoscopy
|
Adult (31-60) | Short-turn | Often balanced | Top-5 Minute Share, OR Minute-Case Gap by Sex |
|
|
Pediatric cluster (<21) | Very short-turn | Often balanced | Kids’ Footprint, OR Minute-Case Gap by Sex |
 Spine and Pain
|
Adult | Medium→long | Often balanced | Top-5 Minute Share, OR Minute-Case Gap by Sex |
 Urology
|
Older male | Medium | Male-skew | Age Load, OR Minute-Case Gap by Sex |
ASC Planning Considerations
Capacity
If Age Load is greater than 40%, where will longer dwell times show first (PACU chairs, turnovers, late finishes)?
Portfolio
If Joint Momentum rises while cases are flat, is minute demand outpacing rooms?
Staffing
Seasonality
Scheduling
Surgery Center Experience
About the Data
Timeframe
Scope
Measures
Cases (count), Payments (dollars), OR time (minutes); segmented by specialty, age, and sex*.
State of the Industry Report: Best Practices & Industry Benchmarks for Optimizing ASC Operations
50+ chapters of thoughtfully curated industry research, first-hand experiences, and insightful data.

Get access to: