HST Pathways
  • Who We Help
    • Surgery Centers
    • Management Groups
    • Anesthesia Providers
    • Physician Practices
    • Health Systems w/ ASCs
    • New Surgery Centers
    • Ophthalmology ASCs
  • Solutions
    • Financial Management
      • Surgery Center Management
      • Case Profit Estimations
    • Clinical Operations
      • Patient Engagement
      • Electronic Charting
    • Financial Clearance
      • Collect & Process Patient Payments
      • Patient Estimates
    • Data & Analytics
      • Raw Surgery Center Data
      • Reporting & Dashboards
    • Scheduling & Collaboration
      • Scheduling & Care Communication
    • Partners & Integrations
      • Explore our powerful connected technologies to help you deliver better care.
  • Resources
    • Podcast
    • Top Resources by Topic
    • Data Benchmarks by Specialty
    • State of the Industry Report
    • HST ROI Calculators
    • Customer Stories
    • Blog
    • Client Awards
  • About
    • Why HST?
    • Team
    • Careers
  • Bundled Products
  • Login
    • Patient Login
    • Client Login
  • Schedule a Demo
Select Page
Orthopedics-header

DATA & INSIGHTS

Who’s on Your Schedule? Demographic Trends & Benchmarks for ASCs
We analyzed more than 5.3 million cases across 635 surgery centers from Q1 2020 to Q2 2025 to answer a simple question with big operational implications: who’s actually on your schedule — and how does that shape minutes and money?

Two populations set the pace. Pediatrics (patients under the age of 21) is concentrated in ENT and Dental and runs fast with predictable, high-throughput windows. Older adults (aged 61–80) dominate Ophthalmology, Orthopedics, and Total Joint, driving OR minutes, and in many centers, payments. Layer in a reliable Q4 lift and a rising Total Joint share, and a clear picture emerges of where cases, dollars, and OR time actually live.

The following definitions are used in this report: a case is a unique surgical encounter; case share is a segment’s percentage of all cases. Payments are total dollars collected per case; payment share is a segment’s percentage of total payments. OR minutes (or OR time) are from wheels-in to wheels-out; OR minute share is a segment’s percentage of total OR minutes.

Key Findings

Older patients drive the day.

Patients aged 61–80 account for the largest share of cases, OR minutes, and payments across the dataset — especially in Ophthalmology, Orthopedics, and Total Joint.

Pediatrics is concentrated and predictable.

Demand from patients under 21 is highly clustered in ENT and Dental, producing shorter cases and predictable, high-throughput windows relative to other specialties.

Minutes follow complexity.

Orthopedics consistently dominates OR minutes, and Total Joint has gained share since 2023 in many centers, increasing its impact on daily capacity.

Sex clarifies the “who.”

Many specialties are balanced by sex (e.g., Orthopedics, ENT, Gastroenterology), while some skew strongly (e.g., Gynecology is 100% female, Urology is male-heavy). In select specialties, minute share by sex can exceed case share, signaling different procedure intensity.

Q4 still matters.

A year-end lift in cases persists, with downstream effects on minutes and collections that are visible in multiple specialties.

Cases, Payments, and OR Minutes by Specialty

Case Share by Specialty

Demand remains diversified with a reliable Q4 lift. Short-turn specialties (GI, Ophthalmology, ENT) anchor case volume, while Orthopedics and Spine contribute a smaller but meaningful share. Expect a repeatable late-Q4 uptick; that’s the period most likely to pressure rooms and finish times.

Self-check

Which two specialties account for most of your case volume — and does that pair change in Q4?
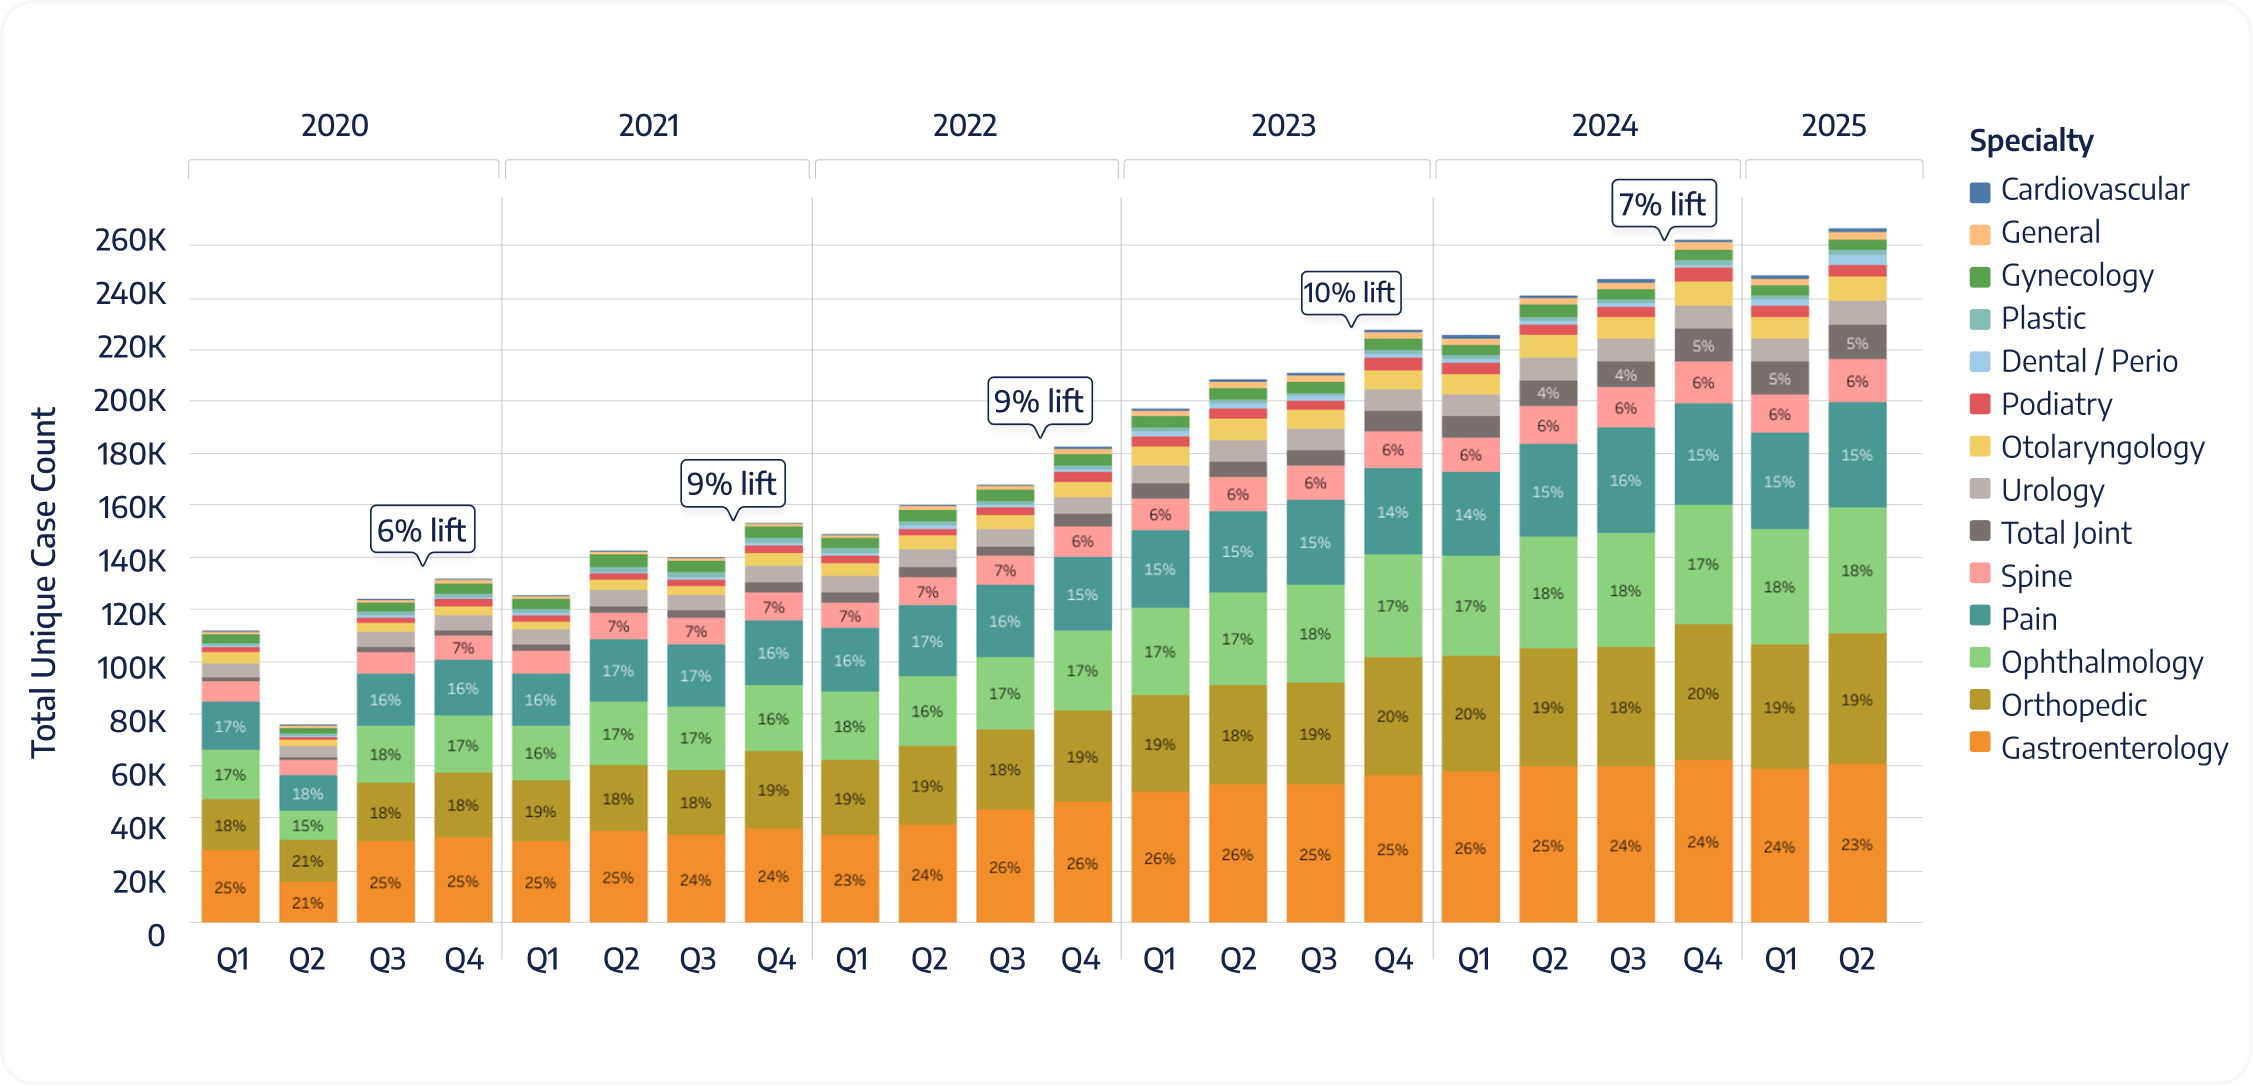

Percentage of Total Cases by Specialty from Q1 2020 to Q2 2025
Q
Percentage of Total Cases by Specialty from Q1 2020 to Q2 2025

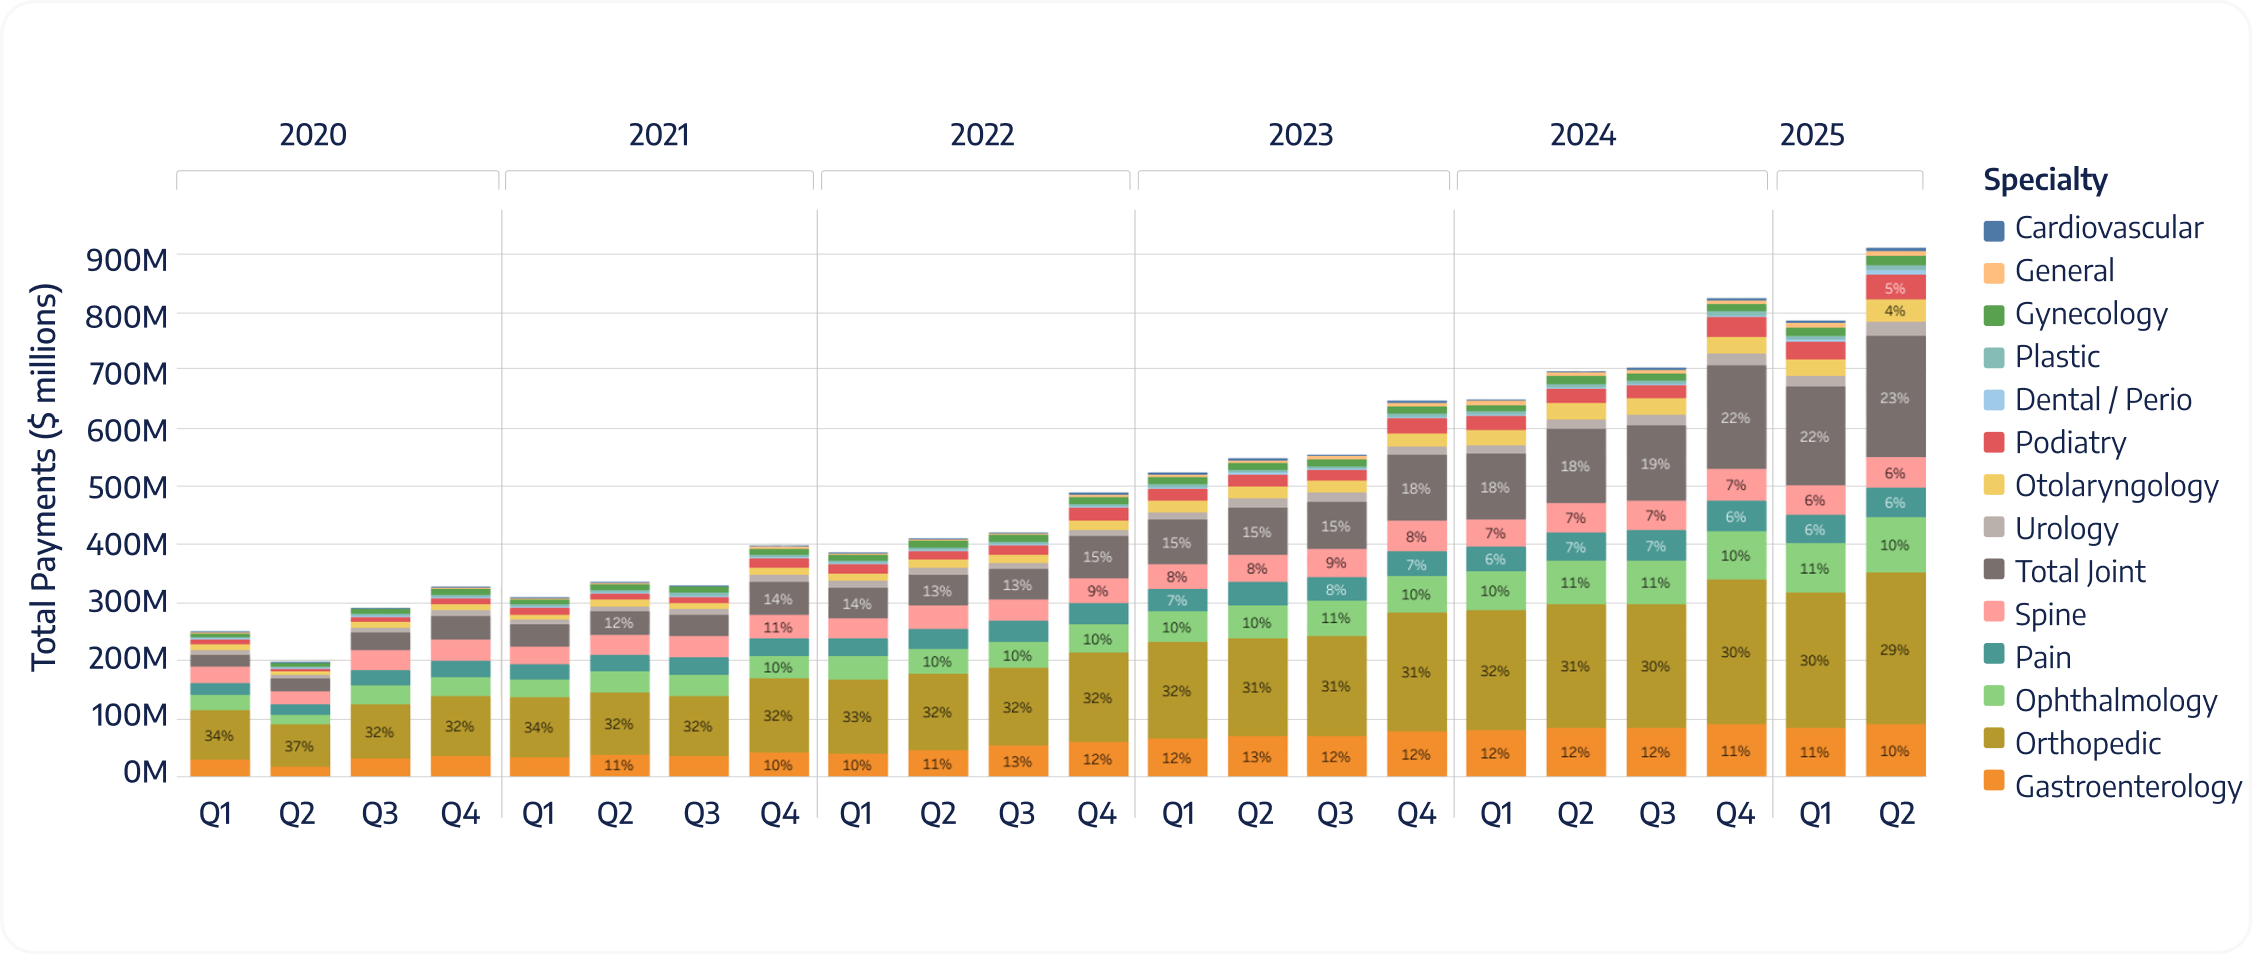
Percentage of Total Payments by Specialty from Q1 2020 to Q2 2025

Q

Percentage of Total Payments by Specialty from Q1 2020 to Q2 2025

Payment Share by Specialty
Revenue concentration differs from case mix. Orthopedics, Ophthalmology, and GI anchor payment share, and Total Joint has gained economic weight in recent years. The divergence between case share change to (short-turn specialties such as Gastroenterology and ENT) and payment share (Orthopedics and Ophthalmology) is a recurring pattern across the dataset.
Self-check

Has Total Joint payment share increased since 2023 at your center?

OR Minute Share by Specialty
OR minutes follow complexity. Orthopedics consistently consumes the most room time, with Total Joint trending upward. Short-turn specialties remain efficient minute-wise despite high case counts. This view surfaces the “few specialties that drive most minutes” reality for capacity planning.
Self-check

Do your five longest specialties account for ~80% of total minutes?
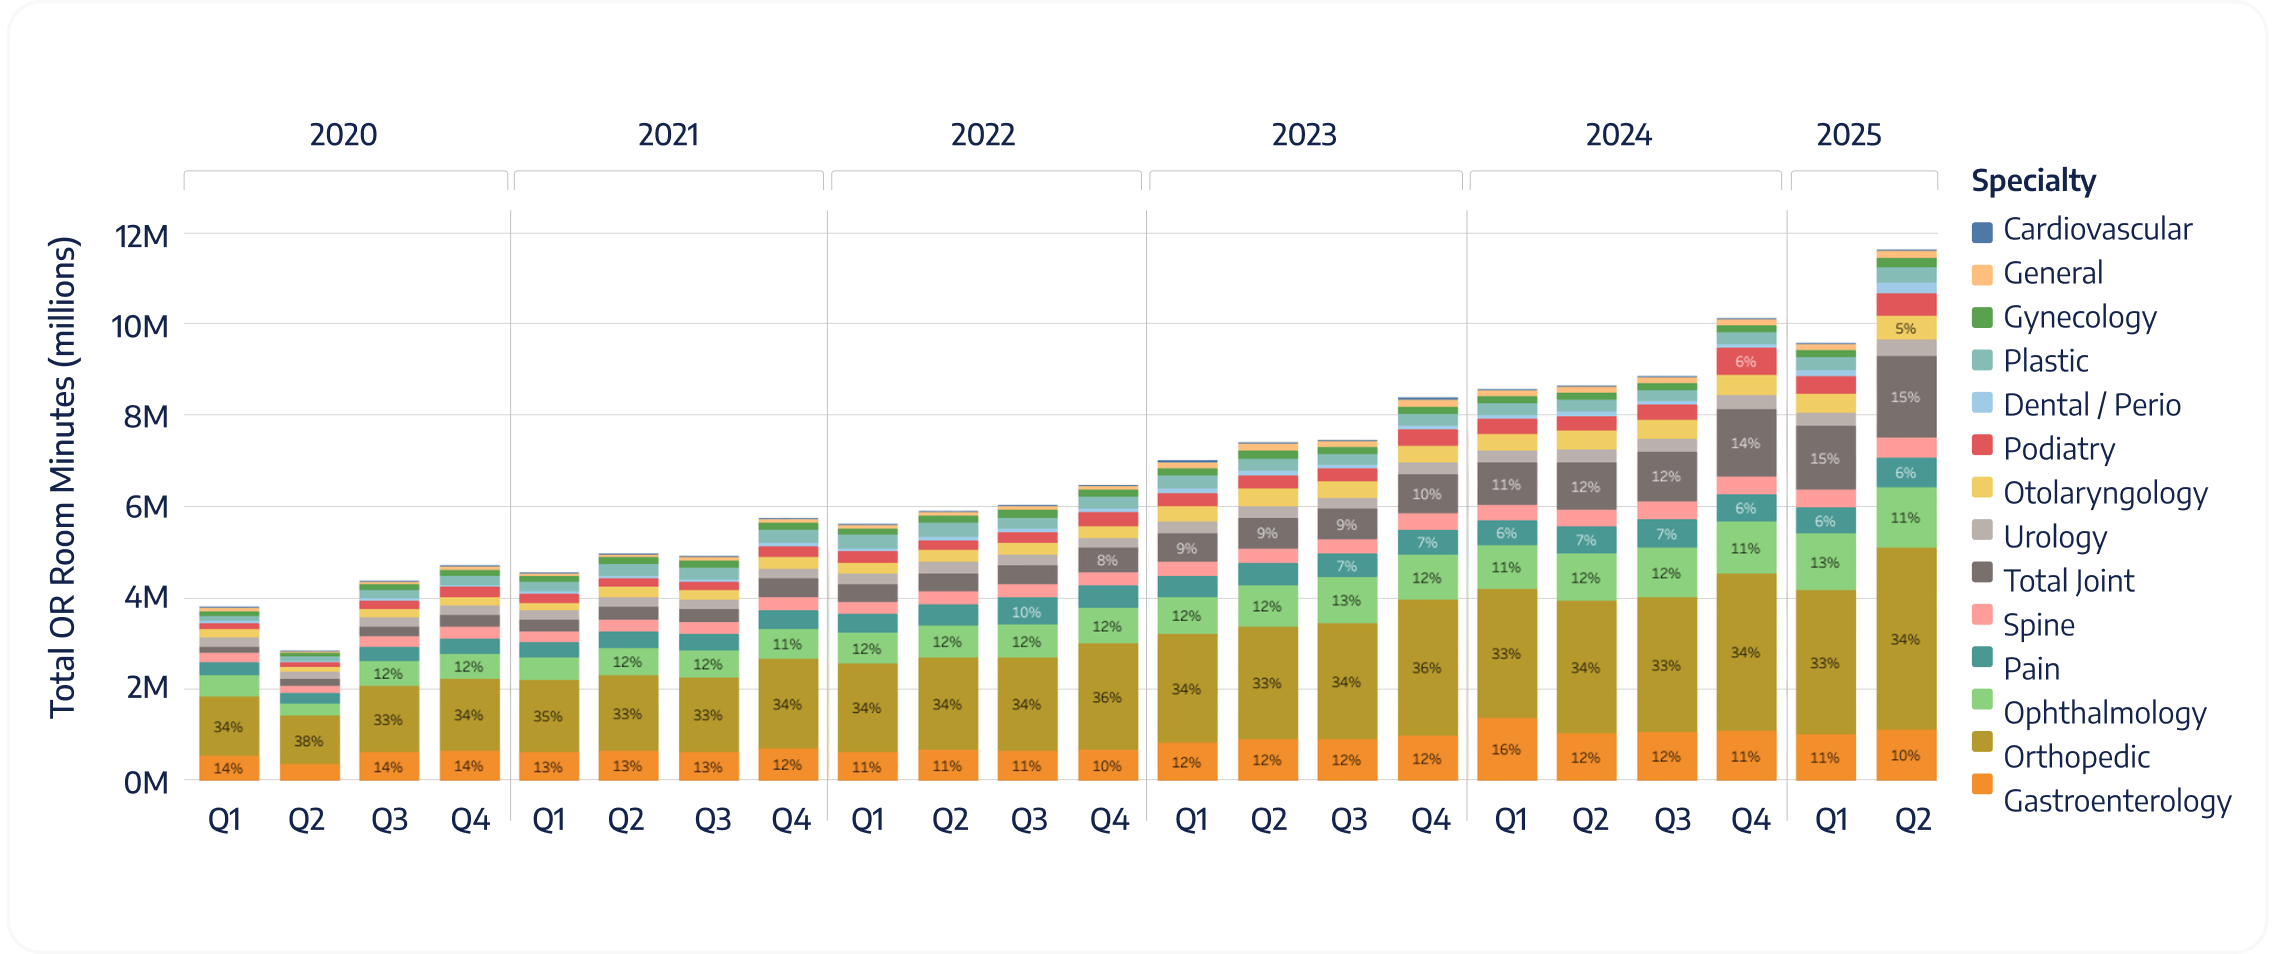

Percentage of Total OR Minutes by Specialty from Q1 2020 to Q2 2025
Q
Percentage of Total OR Minutes by Specialty from Q1 2020 to Q2 2025

Age and Sex Distributions Across Specialties: A Closer Look at How Demographics Predict Cases, Payments, and OR Minutes

Case Share by Age Group
This view shows who is on the schedule today. Adults 61–80 represent the largest portion of total cases, followed by 41–60. Under 21 is the smallest slice (next to 91+, which make up less than 1%) and is concentrated in ENT and Dental. The distribution aligns with the specialty lens (Ophthalmology and Orthopedics skew older; ENT and Dental skew younger) and helps explain why older adults dominate OR minutes and, in many centers, payments.
Self-check

What share of your cases are aged 61–80: <30%, 30–40%, or >40%? And are cases for patients under the age of 21 <10% or ≥10% at your facility?
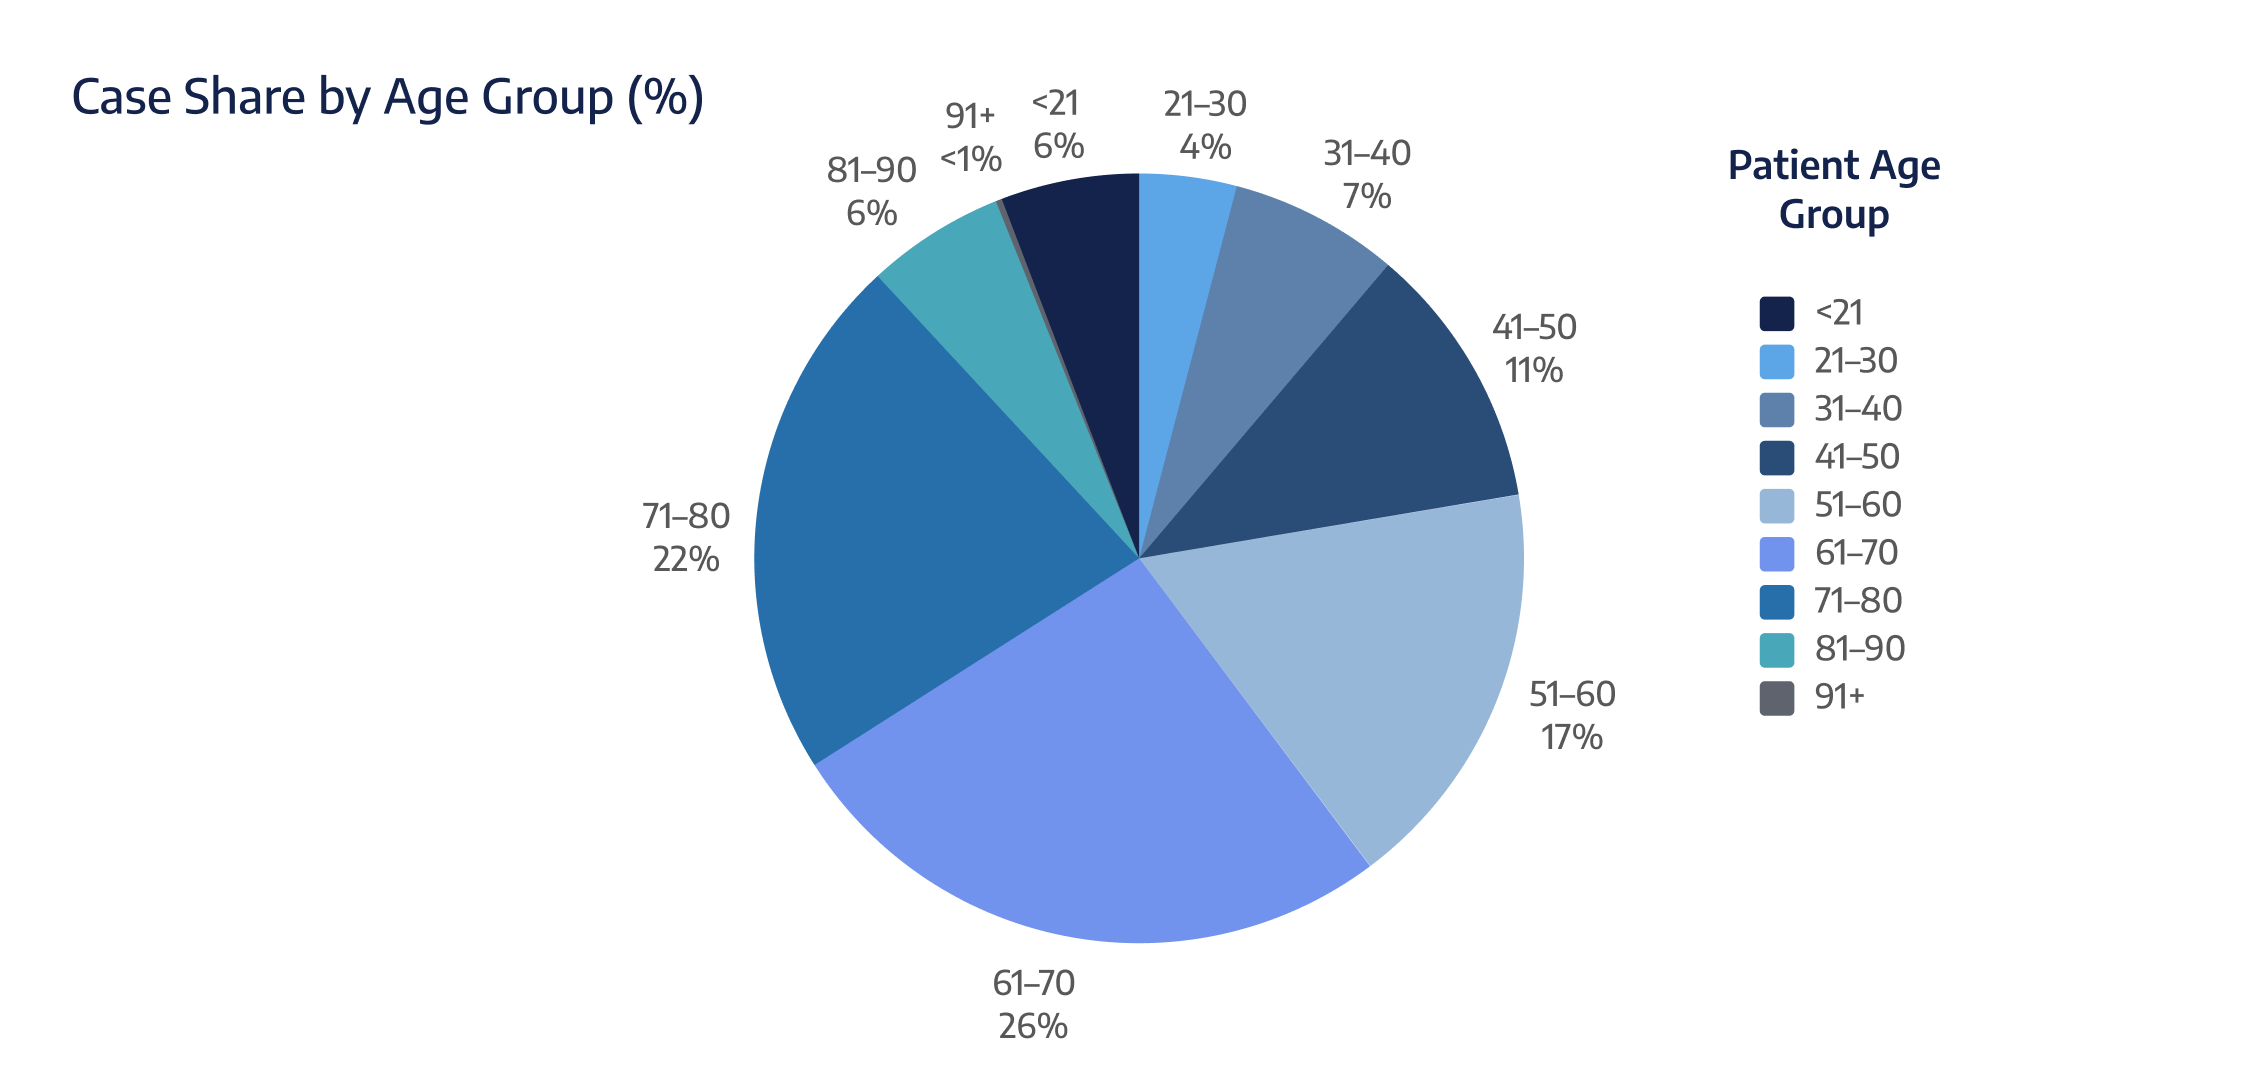

Percentage of Total Cases by Patient Age Group from Q1 2020 to Q2 2025
Q
Percentage of Total Cases by Patient Age Group from Q1 2020 to Q2 2025

Percentage of Total Payments by Patient Age Group from Q1 2020 to Q2 2025
Q
Percentage of Total Payments by Patient Age Group from Q1 2020 to Q2 2025
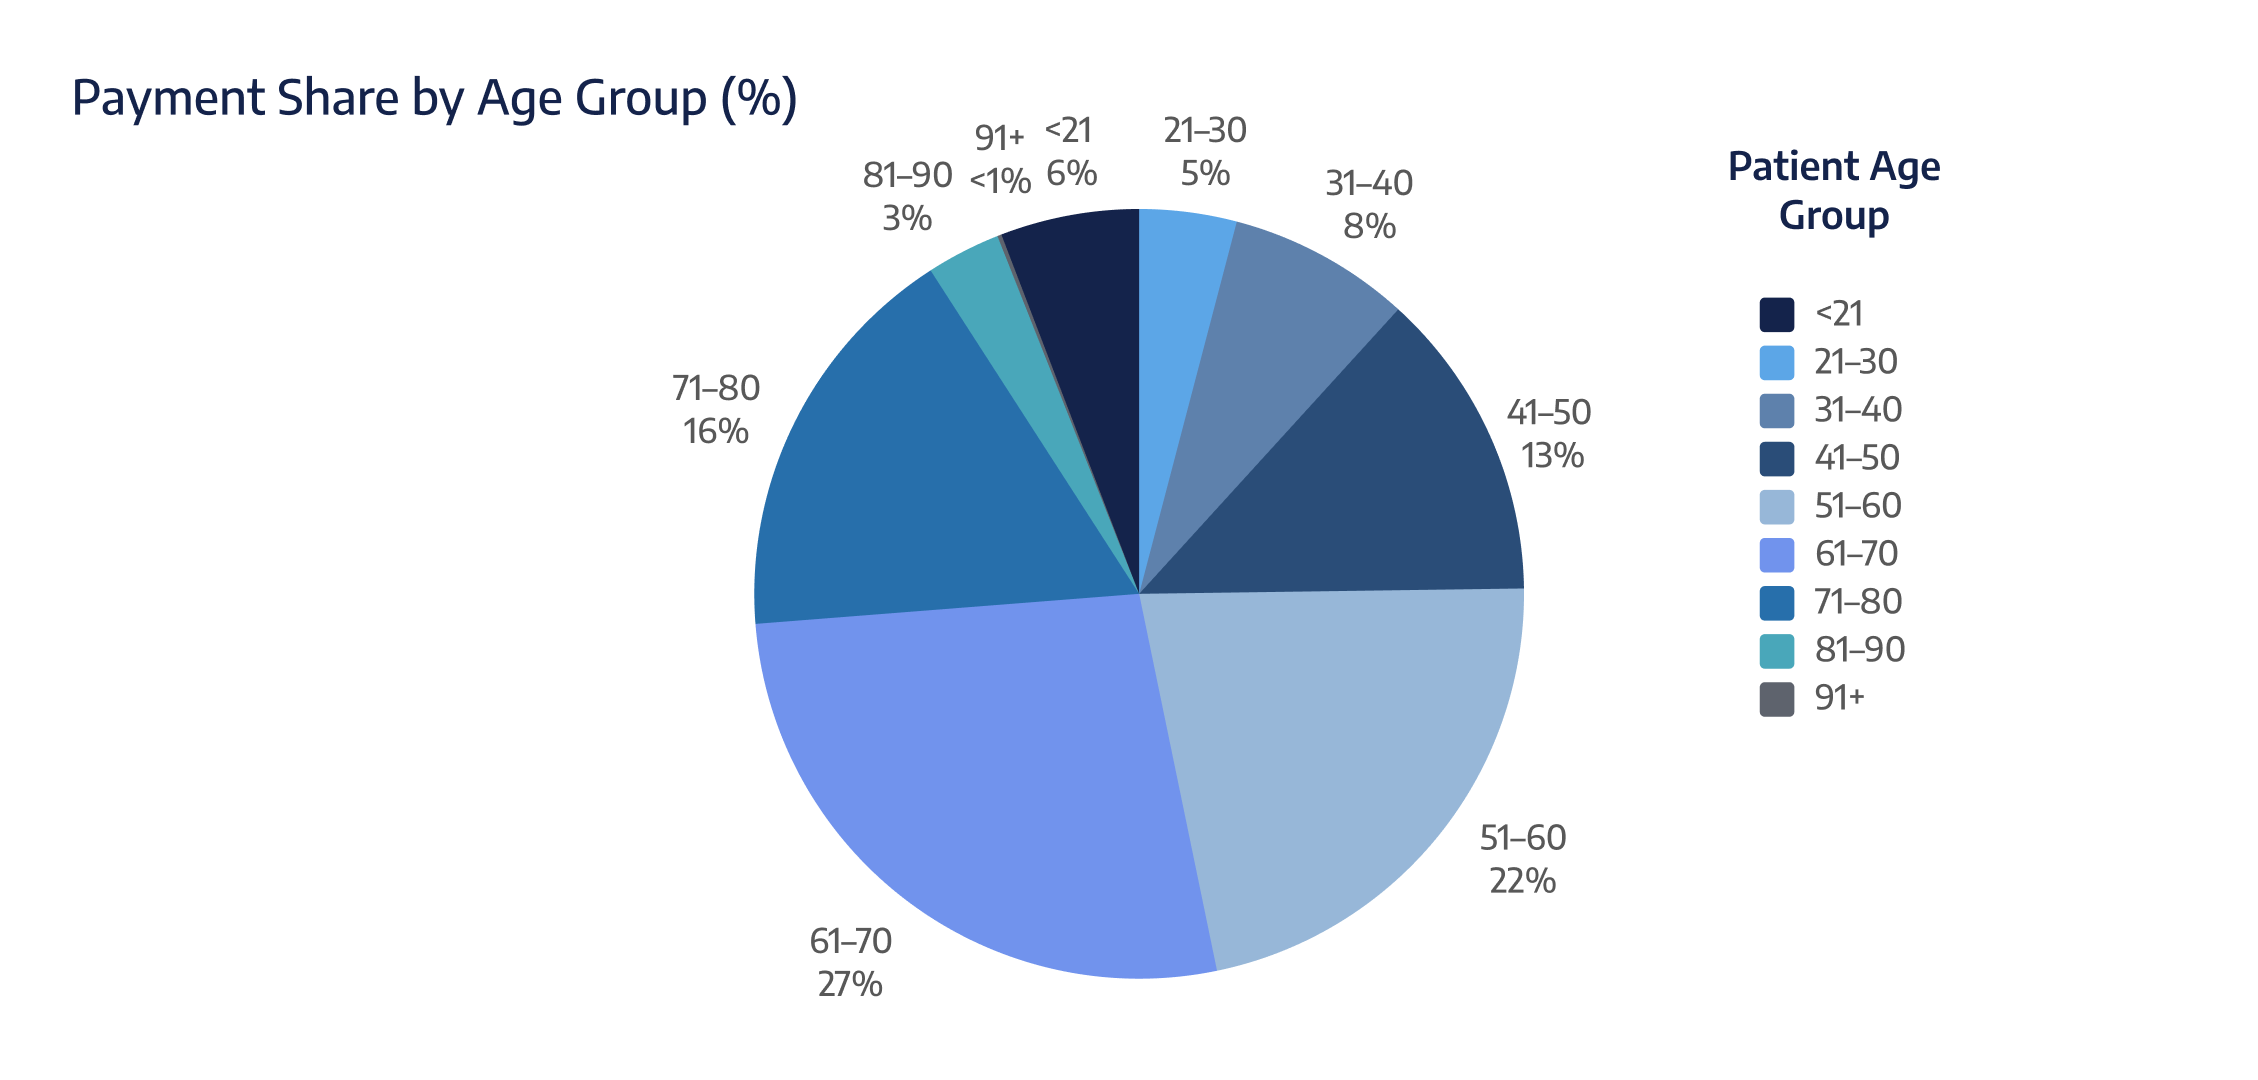
Payment Share by Age Group
Payments concentrate in older adults. Patients aged 61–80 consistently hold the largest share of payments across the time series, broadly tracking Ophthalmology and Orthopedics activity. You’ll see the same pattern reflected in the share of OR minutes by age group.
Self-check

Is your payment share for 61–80 rising, stable, or falling year-over-year?

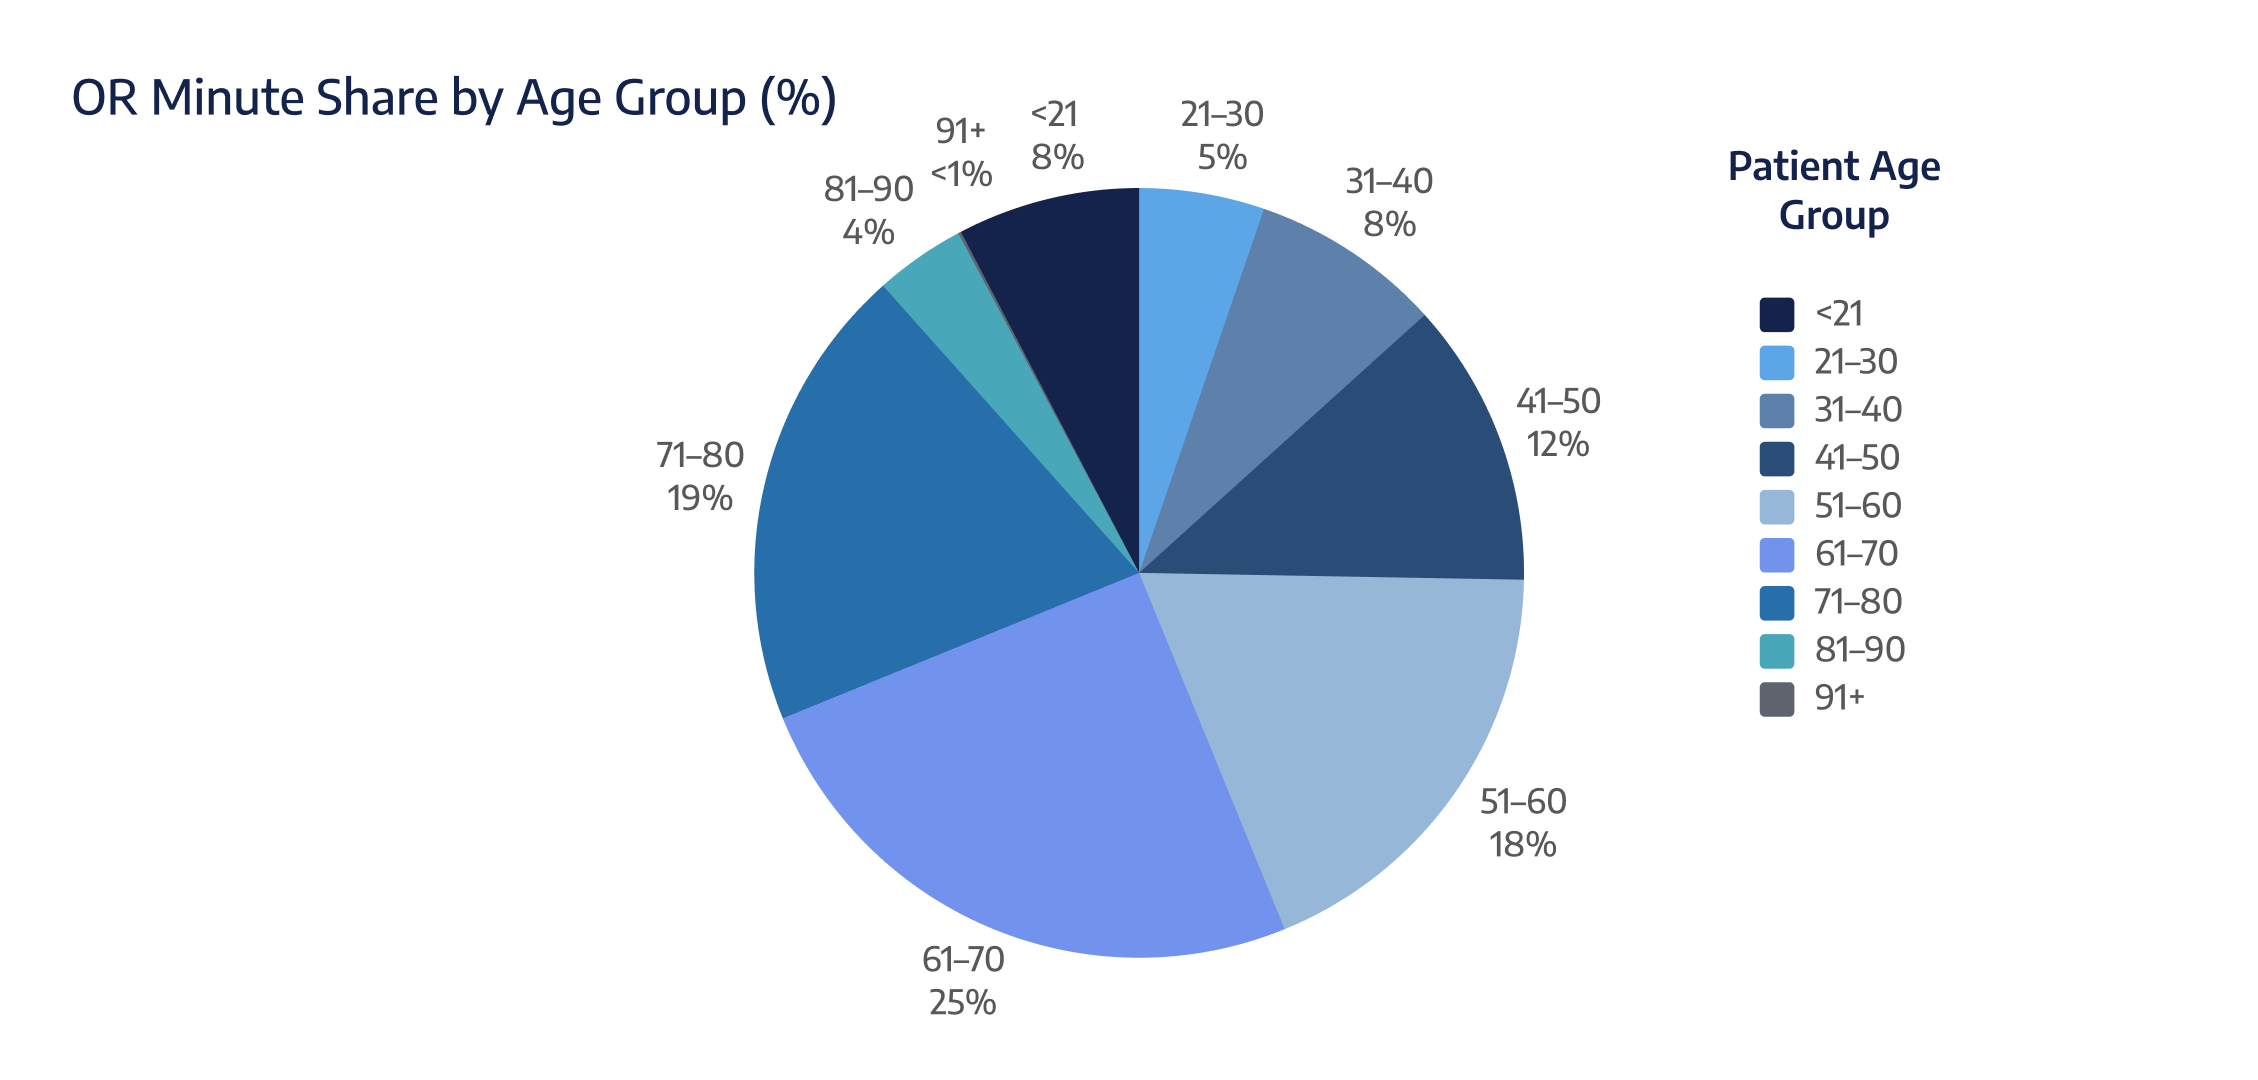
OR Minute Share by Age Group
Older adults drive room minutes. The 61–80 band is the largest, most consistent minute share, which means even small volume changes in this cohort can move finish times and daily predictability. This is your most practical “who dictates the day” lens.
Self-check

What percentage of OR minutes is attributed to patients aged 61–80 right now?

Percentage of Total OR Minutes by Patient Age Group from Q1 2020 to Q2 2025
Q
Percentage of Total OR Minutes by Patient Age Group from Q1 2020 to Q2 2025

Percentage of Total Cases by Age and Specialty from Q1 2020 to Q2 2025
Q
Percentage of Total Cases by Age and Specialty from Q1 2020 to Q2 2025
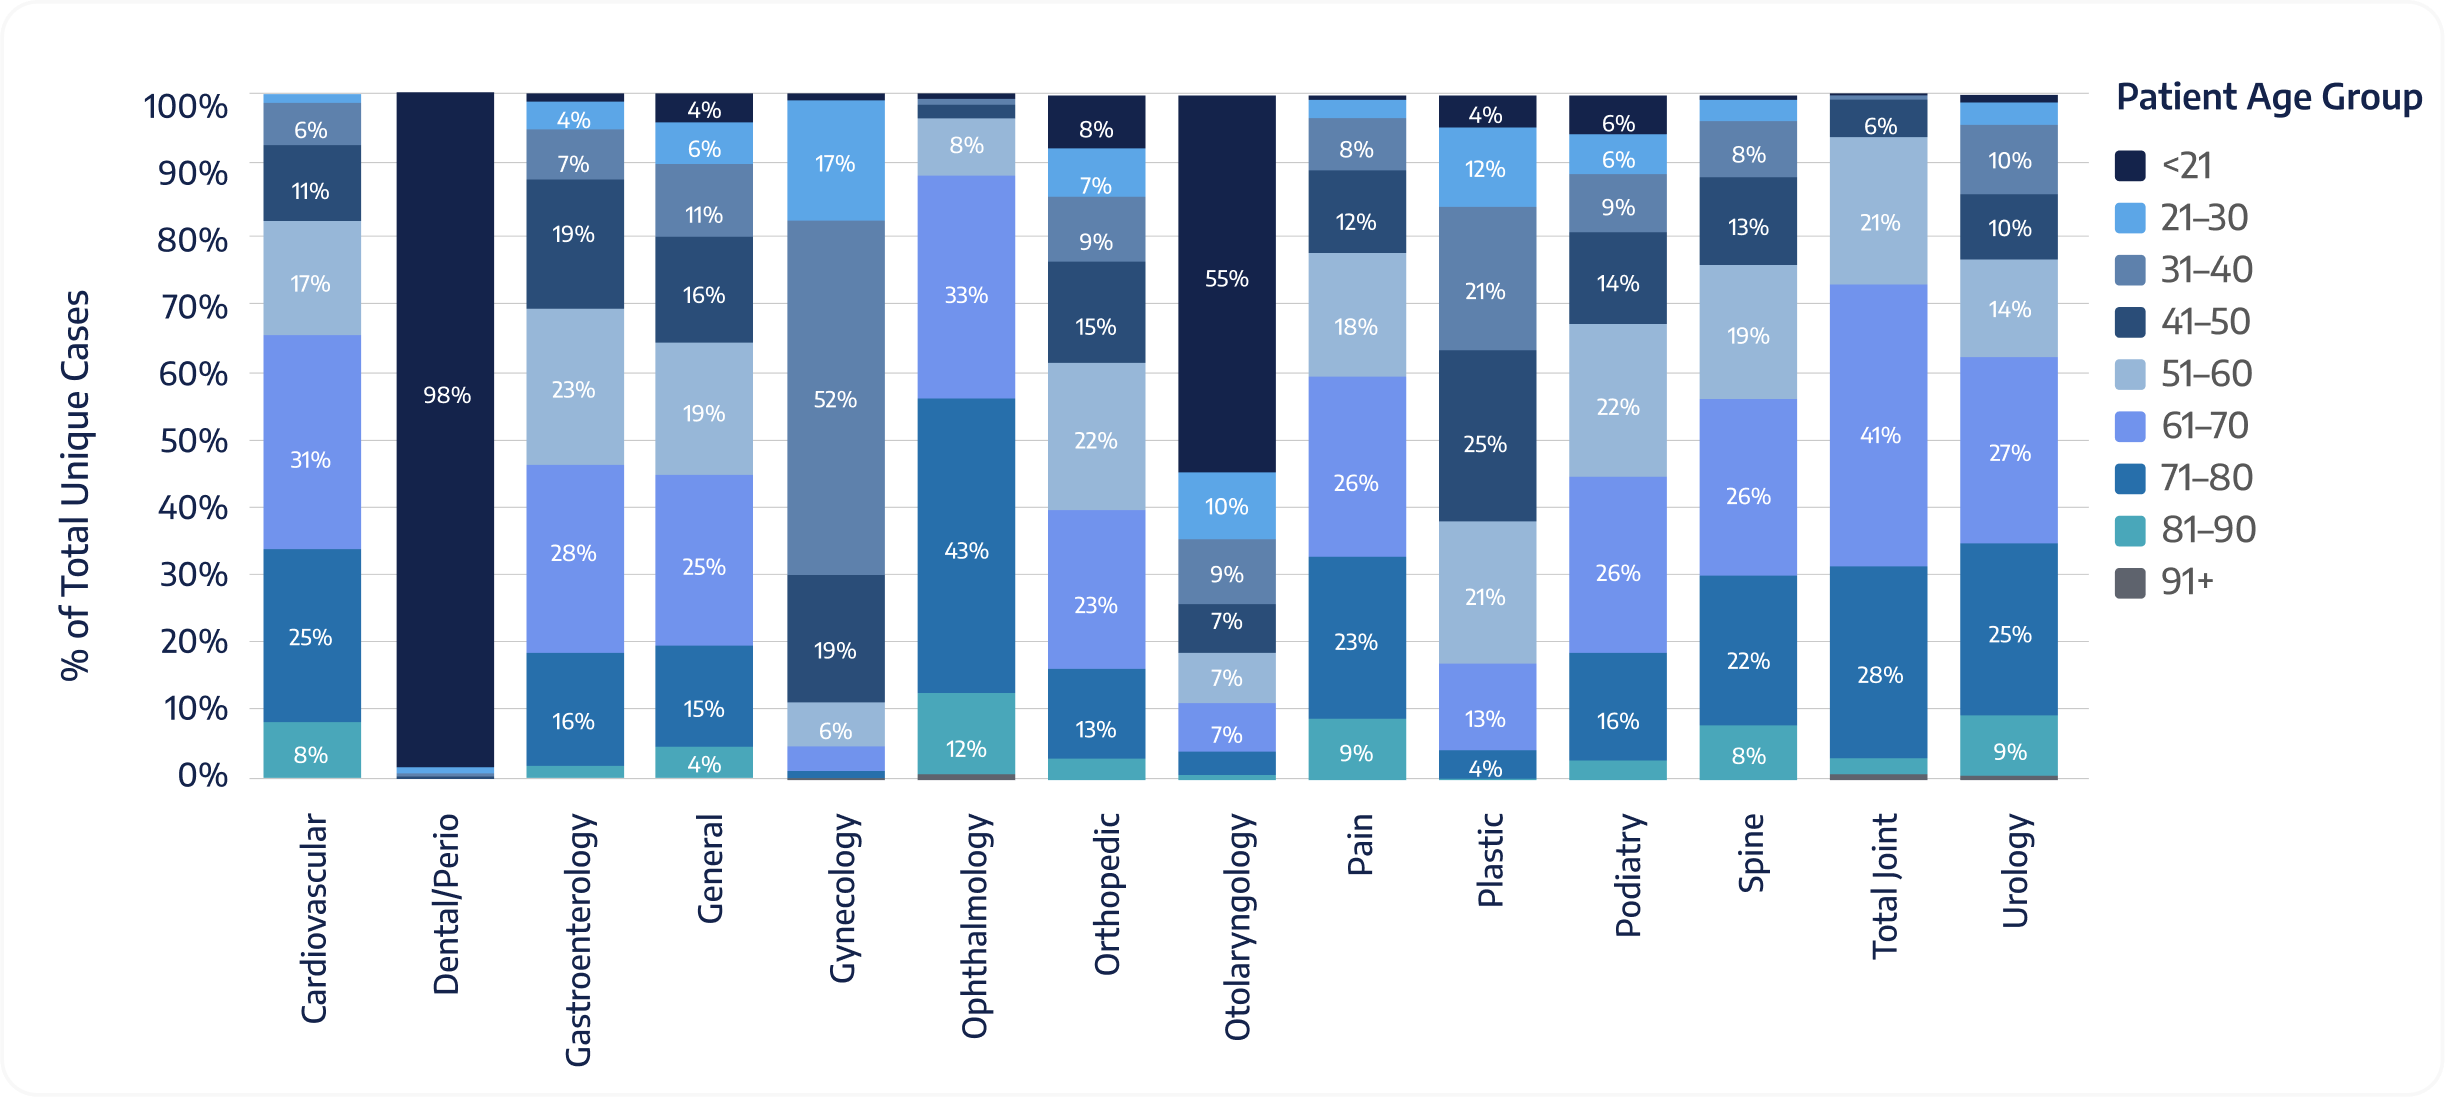
Case Share by Age Group and Specialty
Age concentration is specialty specific. ENT and Dental clusters pediatric cases (<21), while Ophthalmology and Orthopedics skew older. When you zoom in specialty-by-specialty, age becomes a planning signal: pediatrics is high-throughput and predictable; older adults explain longer days.
Self-check

What percentage of your ENT and Dental cases are patients under the age of 21?

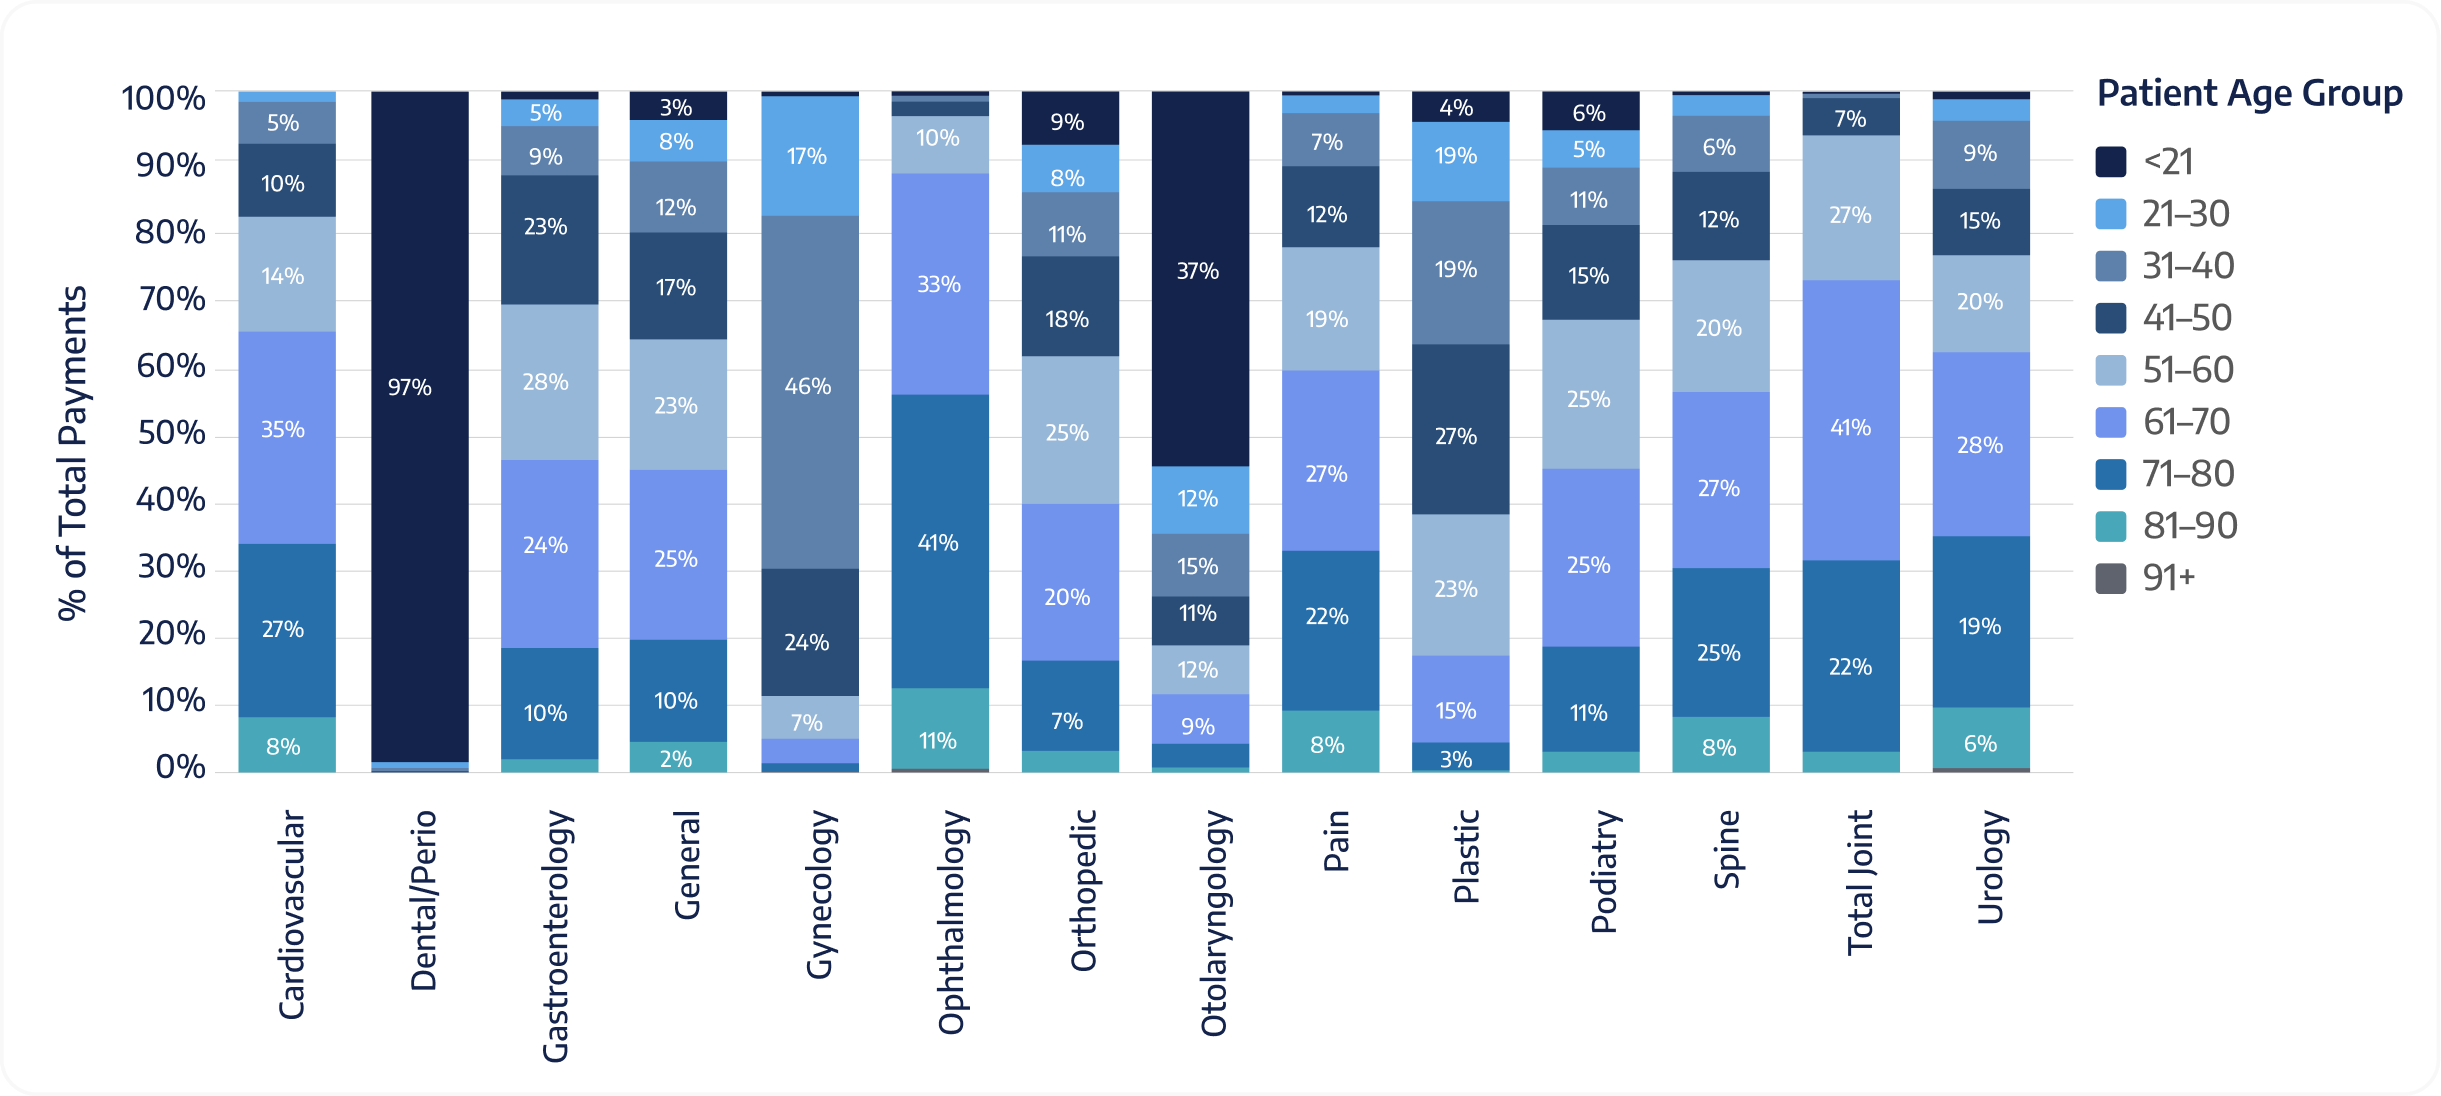
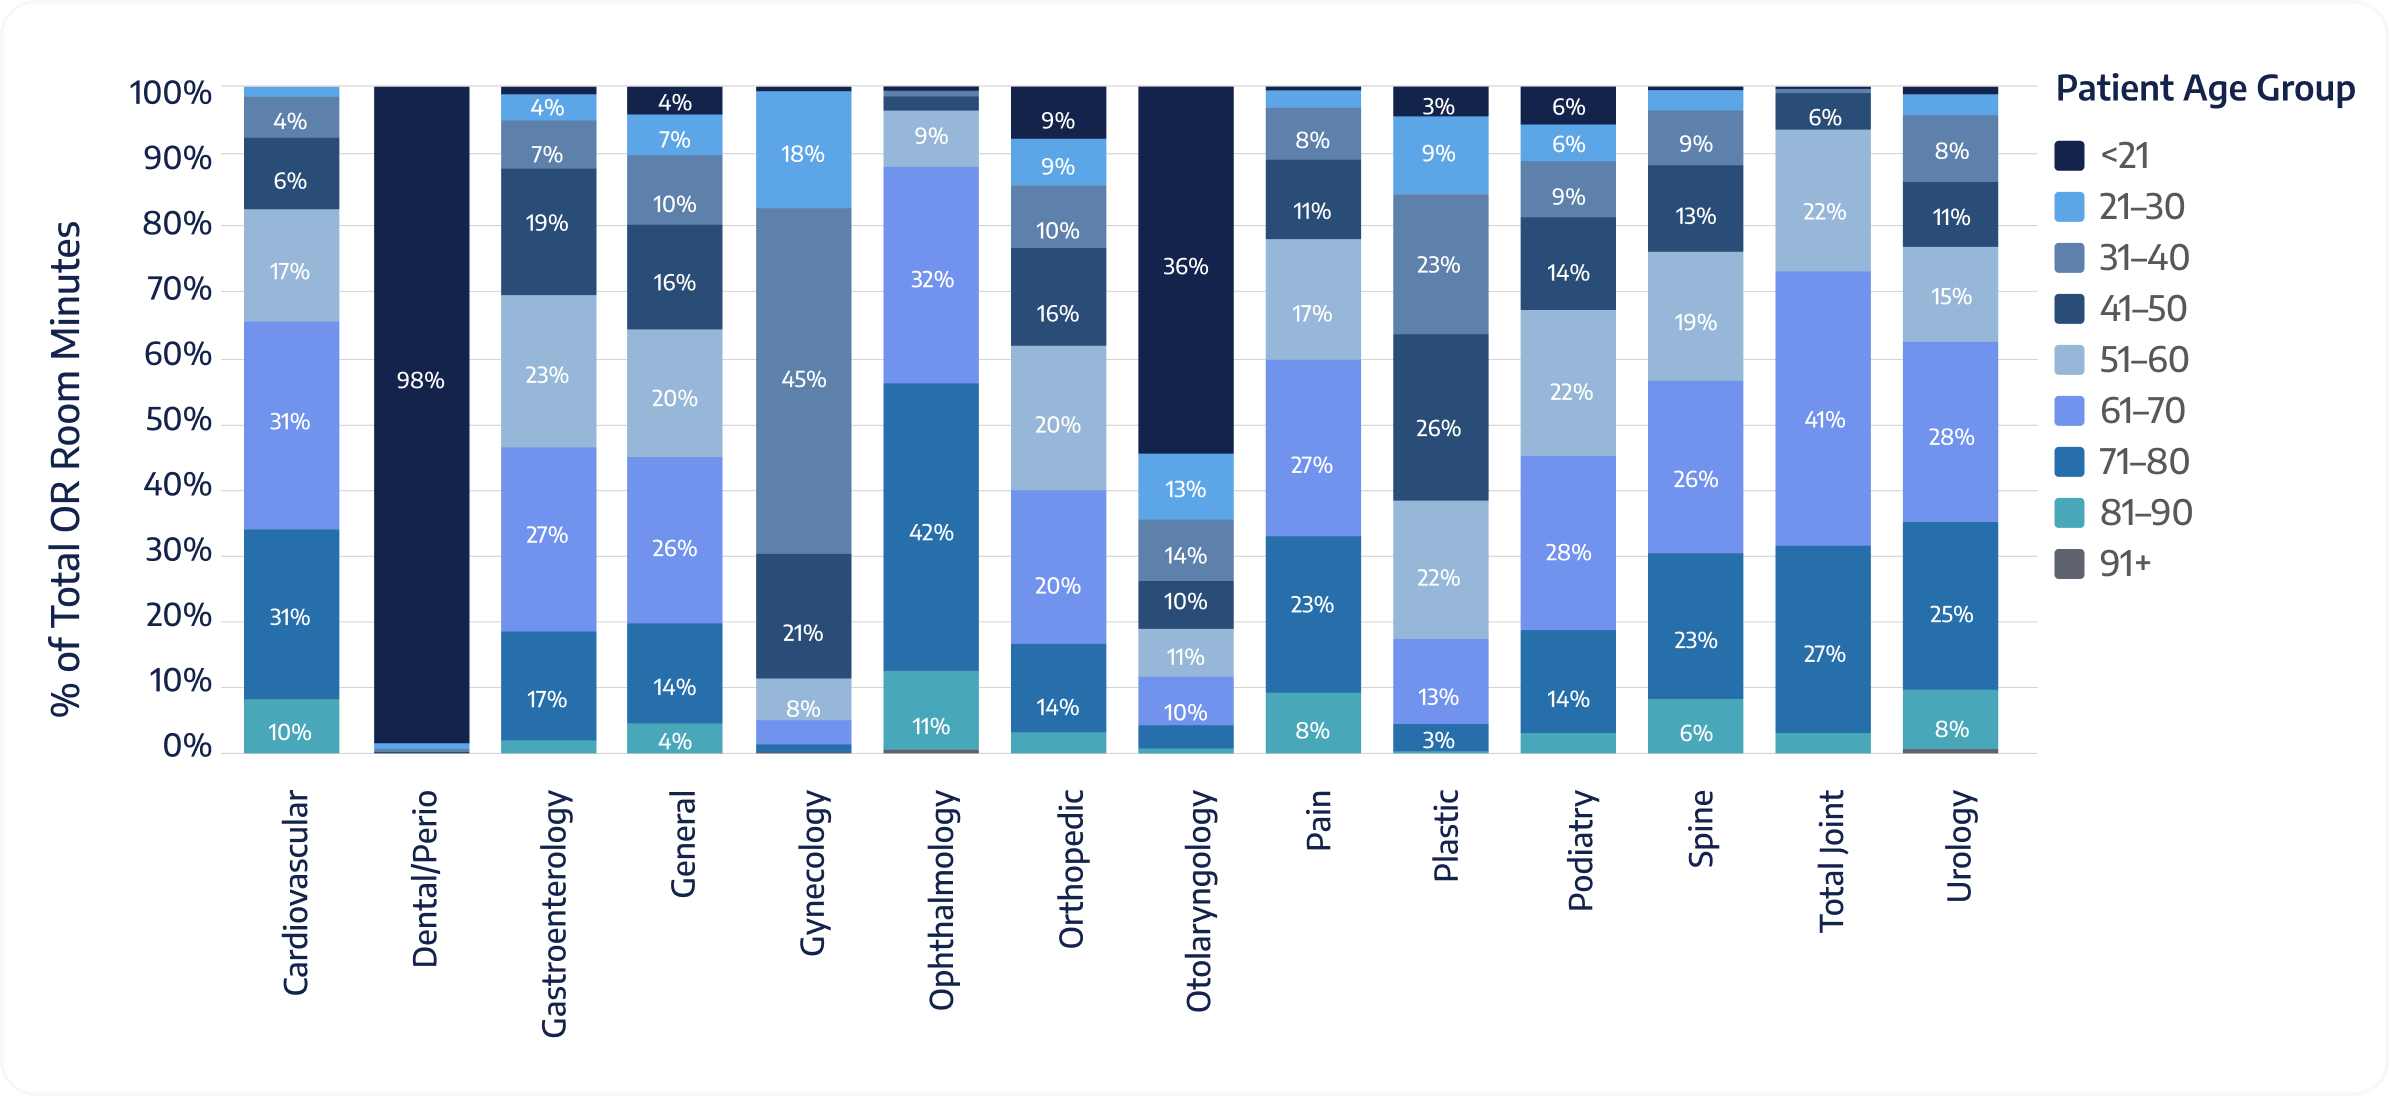
Payment Share by Age Group and Specialty
Within specialties, older cohorts often contribute a higher share of dollars than their case share suggests — especially in Ophthalmology and Orthopedics. This view shows where economic weight sits inside each specialty’s age mix.
Self-check

In Orthopedics, does your share of payments for patients aged 61–80 exceed case share?

Percentage of Total Payments by Age and Specialty from Q1 2020 to Q2 2025
Q
Percentage of Total Payments by Age and Specialty from Q1 2020 to Q2 2025

Percentage of Total OR Minutes by Age and Specialty from Q1 2020 to Q2 2025
Q
Percentage of Total OR Minutes by Age and Specialty from Q1 2020 to Q2 2025
OR Minute Share by Age Group and Specialty
Minute intensity rises with age in most specialties. For Orthopedics, and Total Joint, in particular, older adult cases occupy a disproportionate share of minutes relative to their case count — one reason capacity planning can’t ignore age mix.
Self-check

In your Ortho slice, is OR-minute share for 61–80 higher than case share?

Case Share by Sex and Specialty

Sex distribution varies by specialty. Some are highly skewed (e.g., Gynecology is female-heavy, Urology is male-heavy), while others (Orthopedics, ENT, GI) are closer to balanced. This snapshot clarifies who you serve within each specialty and supports targeted outreach, messaging, and even the experience you offer inside your center.

Self-check

In your top three specialties, is your case mix mostly female, mostly male, or balanced?
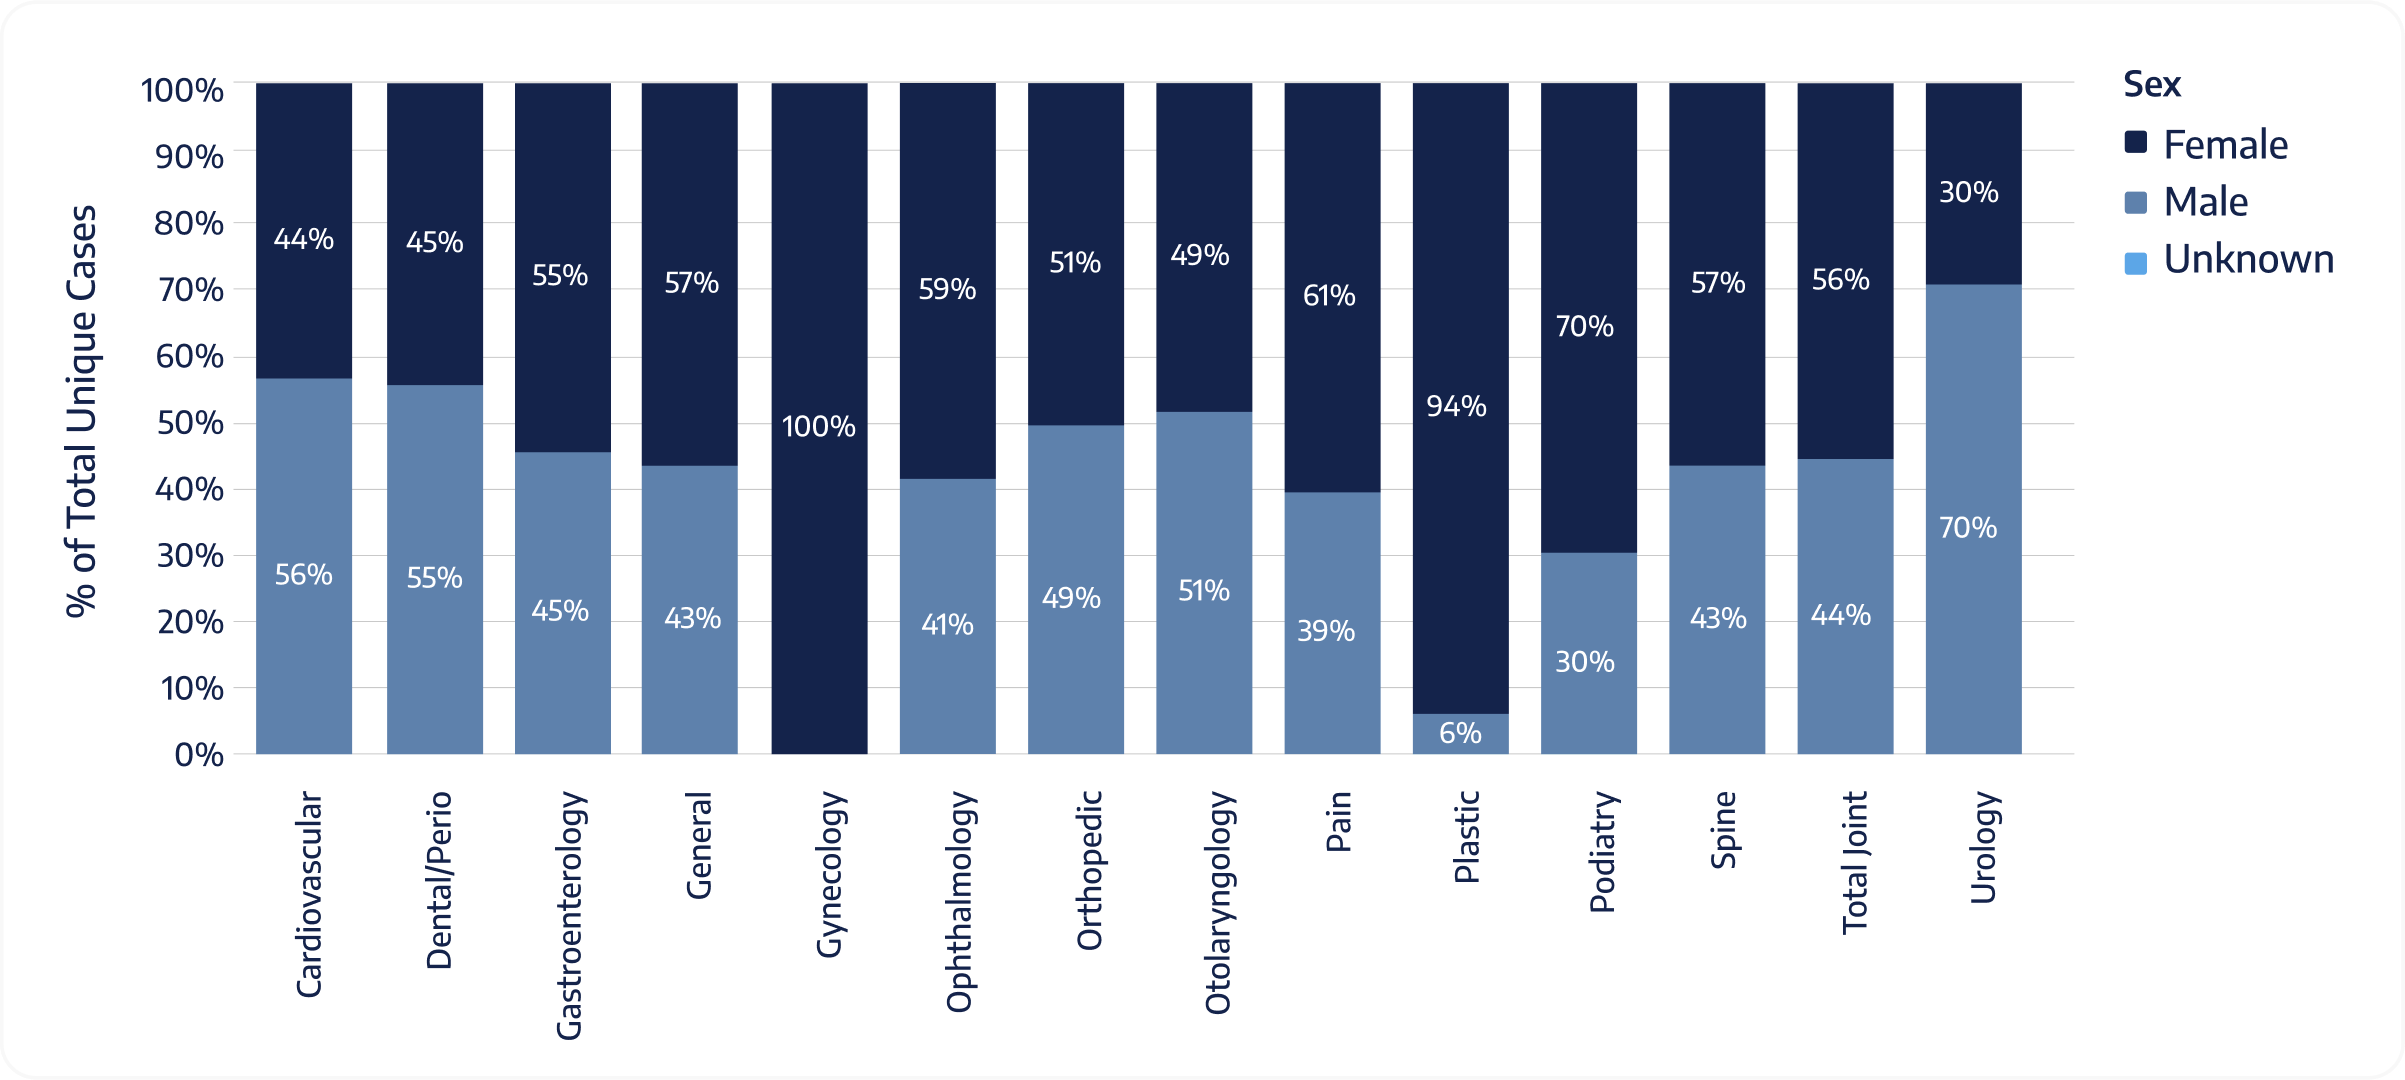

Percentage of Cases by Sex and Specialty from Q1 2020 to Q2 2025
Q
Percentage of Cases by Sex and Specialty from Q1 2020 to Q2 2025

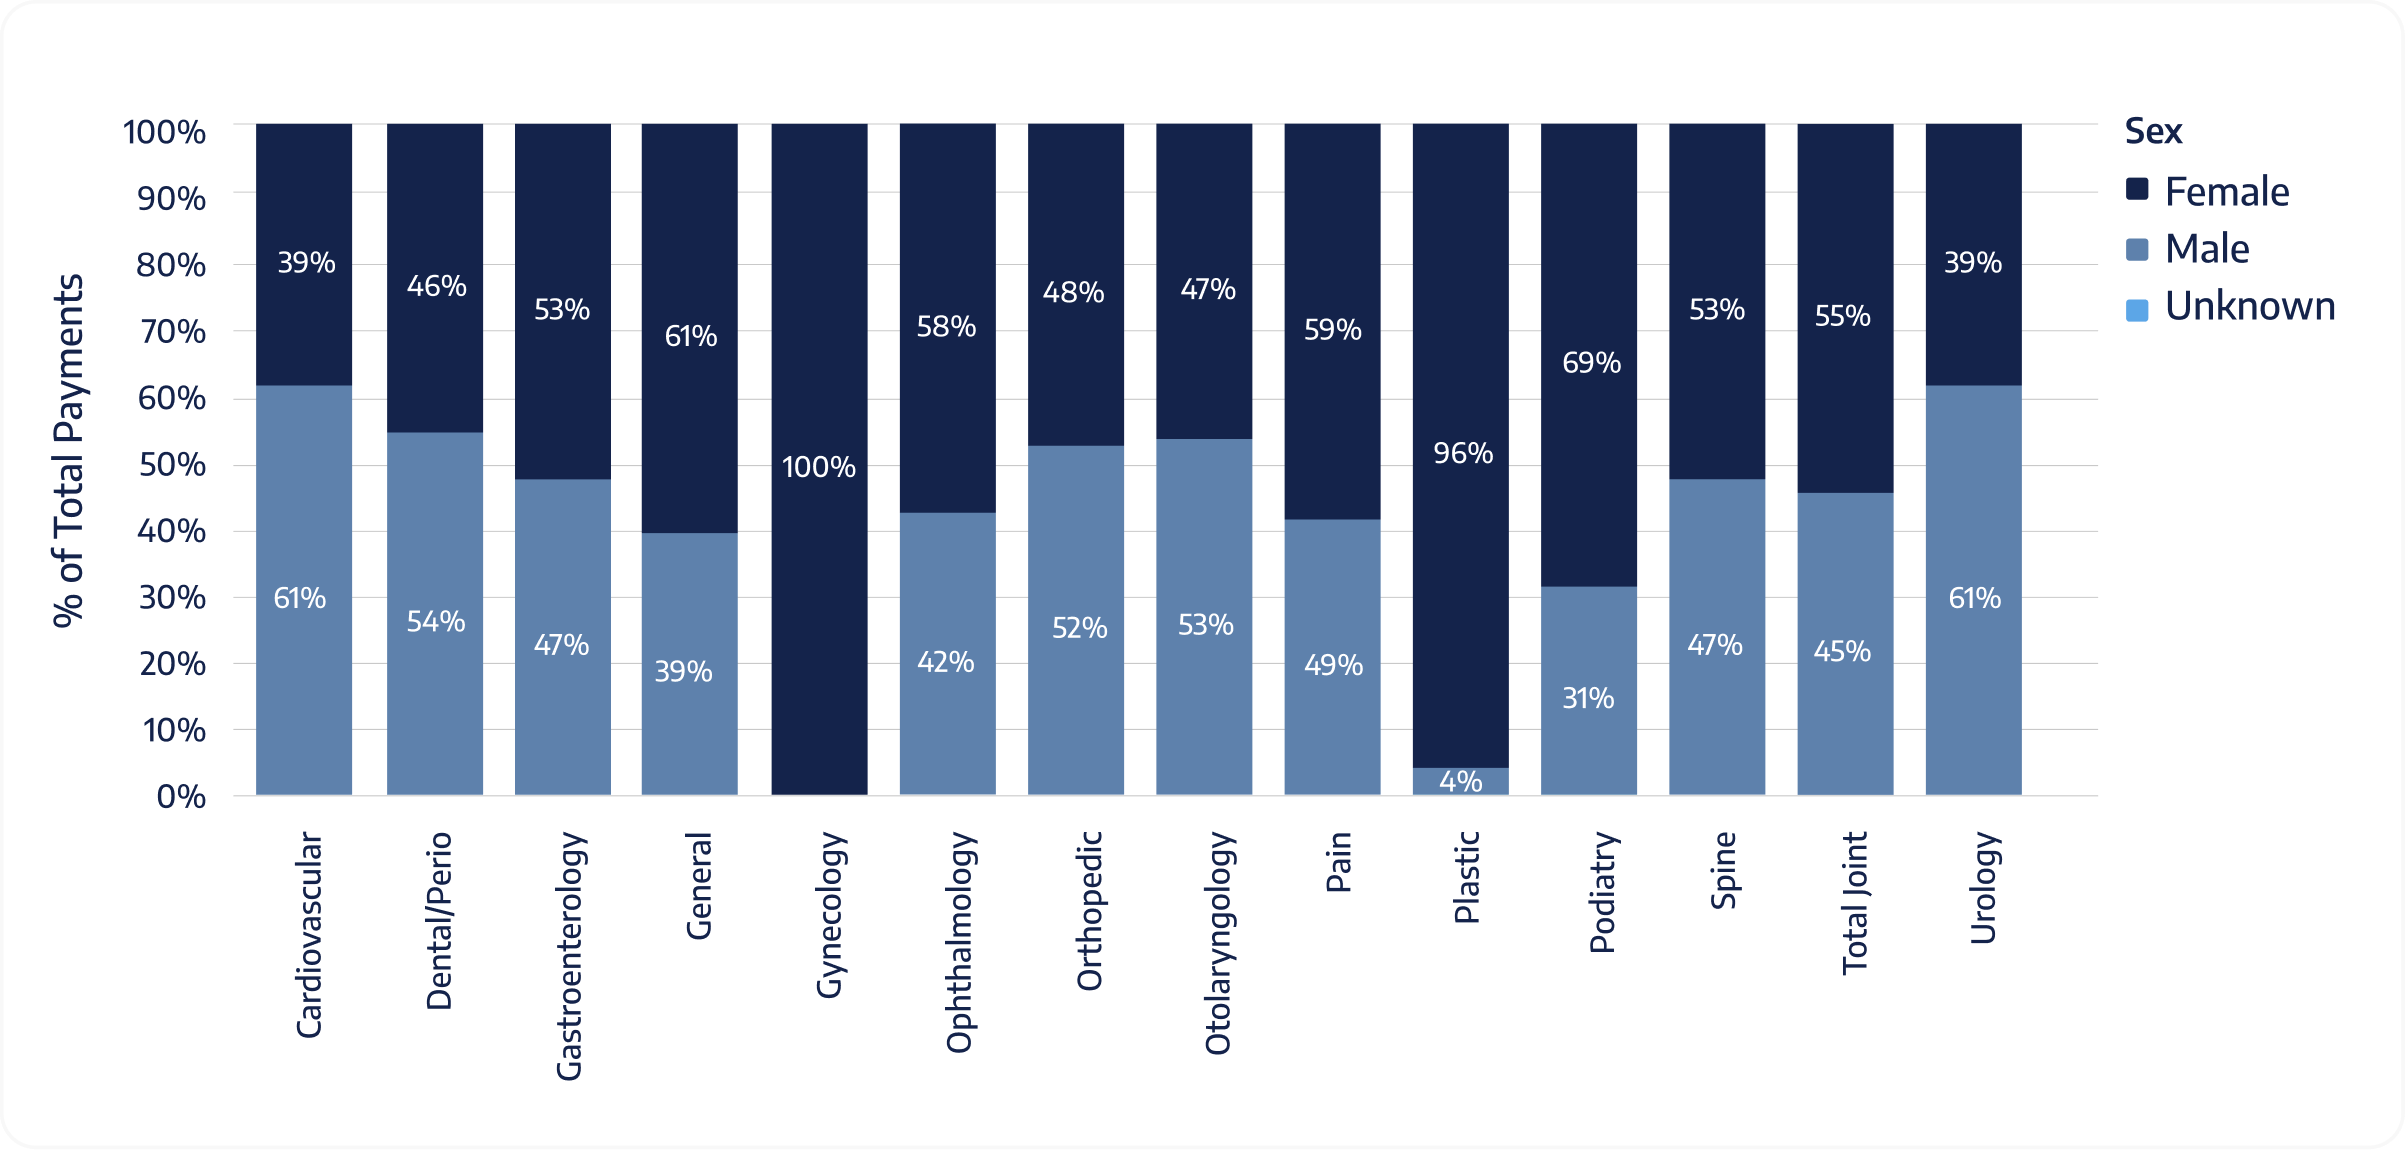
Percentage of Payments by Sex and Specialty from Q1 2020 to Q2 2025
Q
Percentage of Payments by Sex and Specialty from Q1 2020 to Q2 2025
Payment Share by Sex and Specialty
Payment share generally mirrors case mix — but not always. In some specialties, the payment share for a particular sex is higher or lower than its case share, reflecting procedure mix differences. This helps explain why a specialty may look balanced on volume but skewed on dollars.
Self-check

In your top specialties, is payment share for each sex lower / same / higher than their case share?

OR Minute Share by Sex and Specialty

Minute share by sex should typically track case share. When it doesn’t, that signals different procedure intensity. If one sex’s OR-minute share exceeds its case share in a specialty, that’s your OR Minute-Case Gap by Sex  — useful for staffing decisions and throughput expectations.
Self-check

In your top-minute specialty, is OR-minute share for each sex lower / same / higher than their case share?
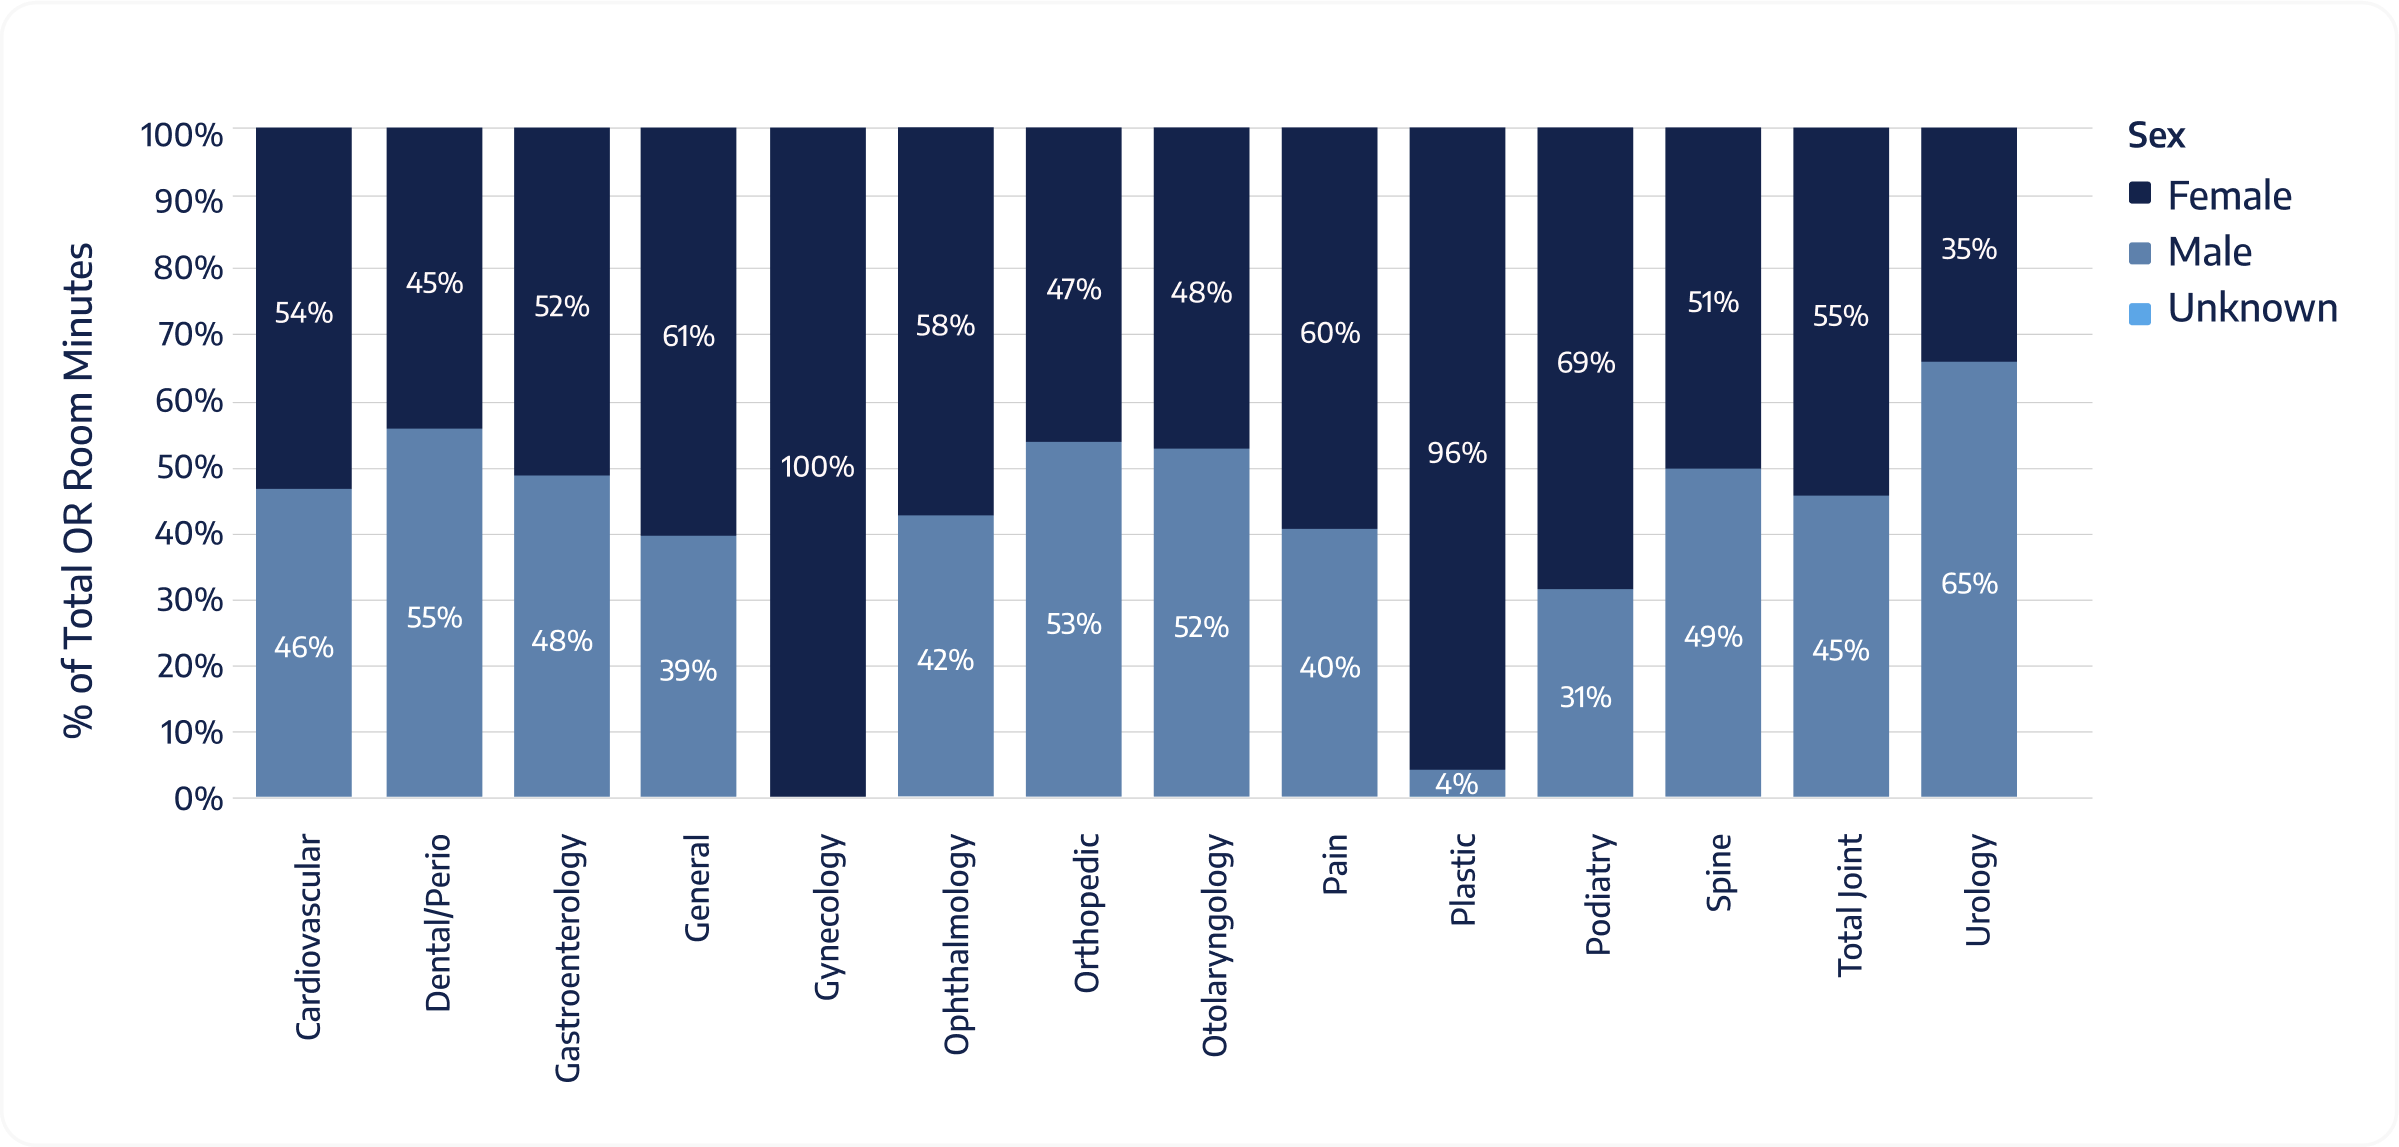

Percentage of OR Minutes by Sex and Specialty from Q1 2020 to Q2 2025
Q
Percentage of OR Minutes by Sex and Specialty from Q1 2020 to Q2 2025

5 Key Benchmarks to Track

  1. 1
    Age Load
    % of OR minutes from patients aged 61–80
  2. 2
    Kids’ Footprint
    % of ENT and Dental cases that are under the age of 21
  3. 3
    Joint Momentum
    % of Orthopedics attributable to Total Joint (use payments or minutes consistently)
  4. 4
    OR Minute-Case Gap by Sex
    Gap = OR-minute % − case % for the dominant sex in your top-minute specialty (Positive gap = longer/more complex procedures for that sex in that specialty)
  5. 5
    Q4 Peak Check
    Is there a significant Q4 case lift vs. your annual average?

Specialty Benchmarks at a Glance

SPECIALTY PRIMARY POPULATION SIGNAL MINUTE PROFILE Sex Distribution MOST USEFUL CHECKPOINTS
Orthopedics and Total Joint
Older adults (61–80) Long-minute Often balanced Age Load, Joint Momentum, OR Minute-Case Gap by Sex
Ophthalmology
Older adults Short-turn, high throughput Often balanced Age Load, OR Minute-Case Gap by Sex
Gastroenterology and Endoscopy
Adult (31-60) Short-turn Often balanced Top-5 Minute Share, OR Minute-Case Gap by Sex
ENT and Dental
Pediatric cluster (<21) Very short-turn Often balanced Kids’ Footprint, OR Minute-Case Gap by Sex
Spine and Pain
Adult Medium→long Often balanced Top-5 Minute Share, OR Minute-Case Gap by Sex
Urology
Older male Medium Male-skew Age Load, OR Minute-Case Gap by Sex

ASC Planning Considerations

Capacity

If Age Load is greater than 40%, where will longer dwell times show first (PACU chairs, turnovers, late finishes)?

Portfolio

If Joint Momentum rises while cases are flat, is minute demand outpacing rooms?

Staffing

If your OR Minute-Case Gap by Sex is greater than or equal to +3 percentage points in a top specialty, does your staffing matrix reflect longer average procedure time for that group?

Seasonality

If your Q4 peak is moderate to strong, which days and specialties drive it — and do staffing and turnover plans reflect that pattern?

Scheduling

If Kids’ Footprint is greater than 50% in ENT and Dental, are windows consolidated for predictability?

Surgery Center Experience

Knowing who’s on your schedule, do you strategically plan pathways and procedures around their unique needs to help the day run smoother?

About the Data

Timeframe

The data comprises the first quarter of 2020 through the second quarter of 2025.

Scope

We analyzed over 5.3 million cases from 635 HST client ASCs across the U.S. who have granted permission for their data to be used in this study.

Measures

Cases (count), Payments (dollars), OR time (minutes); segmented by specialty, age, and sex*.

*A note on the Sex data: This field represents sex as recorded at registration in contributing systems and may not be reflective of gender identity. Small counts may be suppressed for privacy. Use for descriptive benchmarking only, not clinical decision-making.
HST Pathways Logo
State of the Industry Report: Best Practices & Industry Benchmarks for Optimizing ASC Operations

50+ chapters of thoughtfully curated industry research, first-hand experiences, and insightful data.

Read the Full State of the Industry Report

Get access to:

Benchmarks & data from 3 million cases
130+ KPIs to track
Best practices for the patient journey
Insights into industry trends
VIEW THE REPORT
*Disclaimer: Data on this page may differ from the full 2024 State of the ASC Industry report. The full report (published September 2024) included data through Q2 2024, while this page (published March 2025) includes data through Q4 2024. Differences are due to the extended timeframe and new data from clients who have since granted permission.
Ready to Transform Your ASC?
CONTACT SALES

HST Pathways Logo


SOLUTIONS

Bundled Products
Surgery Center Management
Electronic Charting
Scheduling & Care Communication
Patient Estimates
Patient Engagement
Case Profit Estimations
Patient Payments
Raw Surgery Center Data

RESOURCES

Blog
Podcast
Customer Stories
HST ROI Calculators
Partners & Integrations
Compliance, Privacy, and Security Overview
Your Guide to ASC Software
Your Guide to ASC EMR Systems

ABOUT

Why HST?
Team
Careers

Best in KLAS 2024

CONTACT

Contact Us

Client Support
Patient Support

3102 West End Avenue
Suite 400
Nashville, TN 37203

© Copyright HST, Healthcare Systems & Technologies, LLC 2025. All rights reserved.   |   Privacy Policy   |   Terms and Conditions