DASHBOARDS
The easiest way for centers to visualize pre-built analytics, powered by the most accurate ASC data.
-
Make better decisions with out-of-the-box, actionable data
-
Experience an intuitive analytics tool, no data expertise needed
-
Simplify complex data and boost your ASC’s performance

Trusted by 1,700+ ASCs and 75,000+ users












Powerful visual insights for proactive ASCs
Effortless data exploration for your center
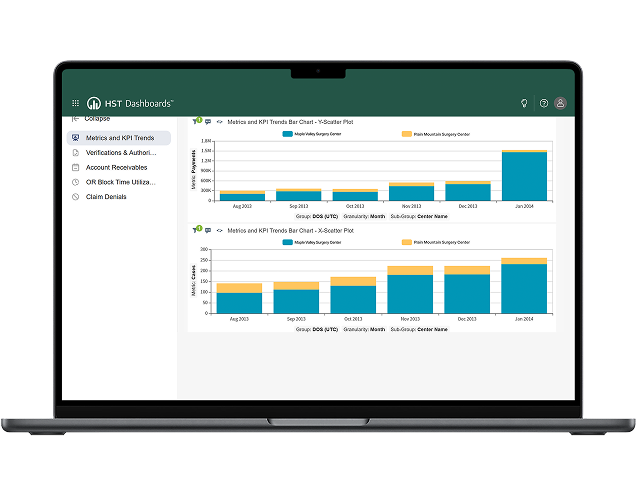
See key metrics on your ASC’s volume, gross and net
revenue, payments, and contract fees at a glance.

Powered by HST’s Trusted Data
Instant Visual Insights

Fast Decision-
Making

Flexible Role Access
Save Time
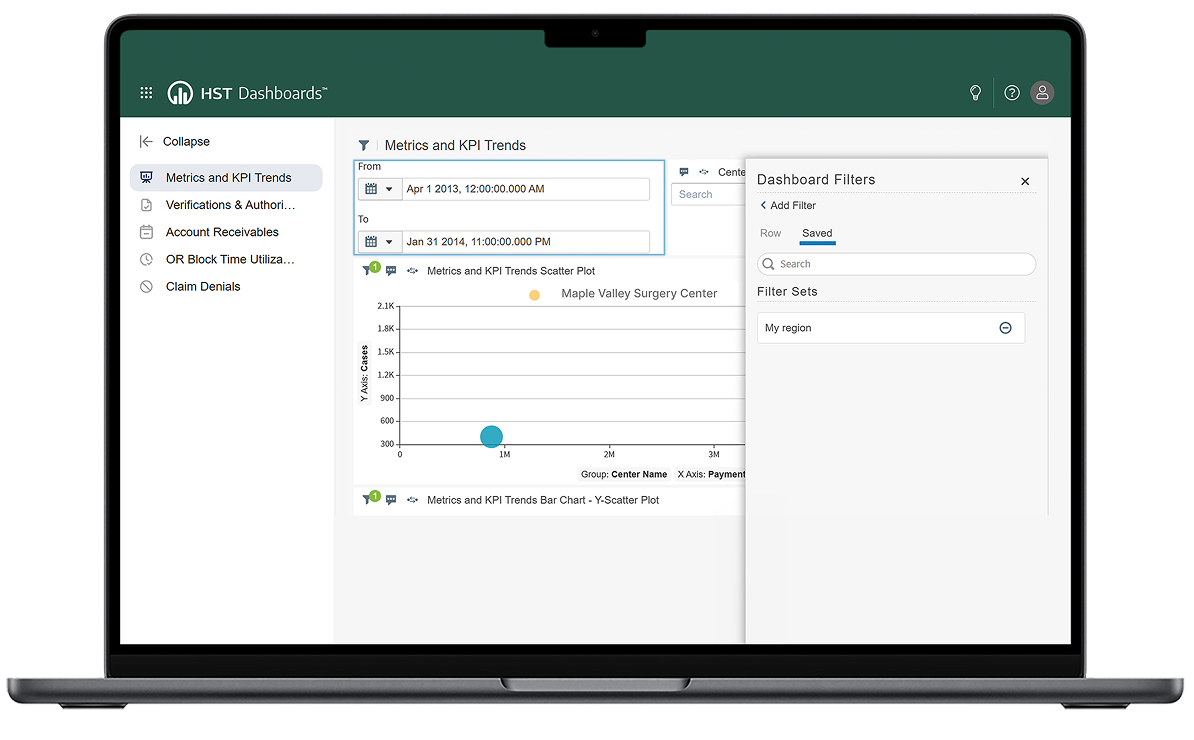
1. Assign Role Access
Choose from center level, regional, or enterprise access so the right people see the right data.

We’ve also noticed a significant increase in job satisfaction amongst staff. They now have the tools to do their job in the way they want to do. They feel current and confident and that’s important.”
Nurse & Team Lead, Quad City ASC

One of the things I also love about HST – as big as you are, it always feels like you have someone here for us.”
Administrator, UroPartners
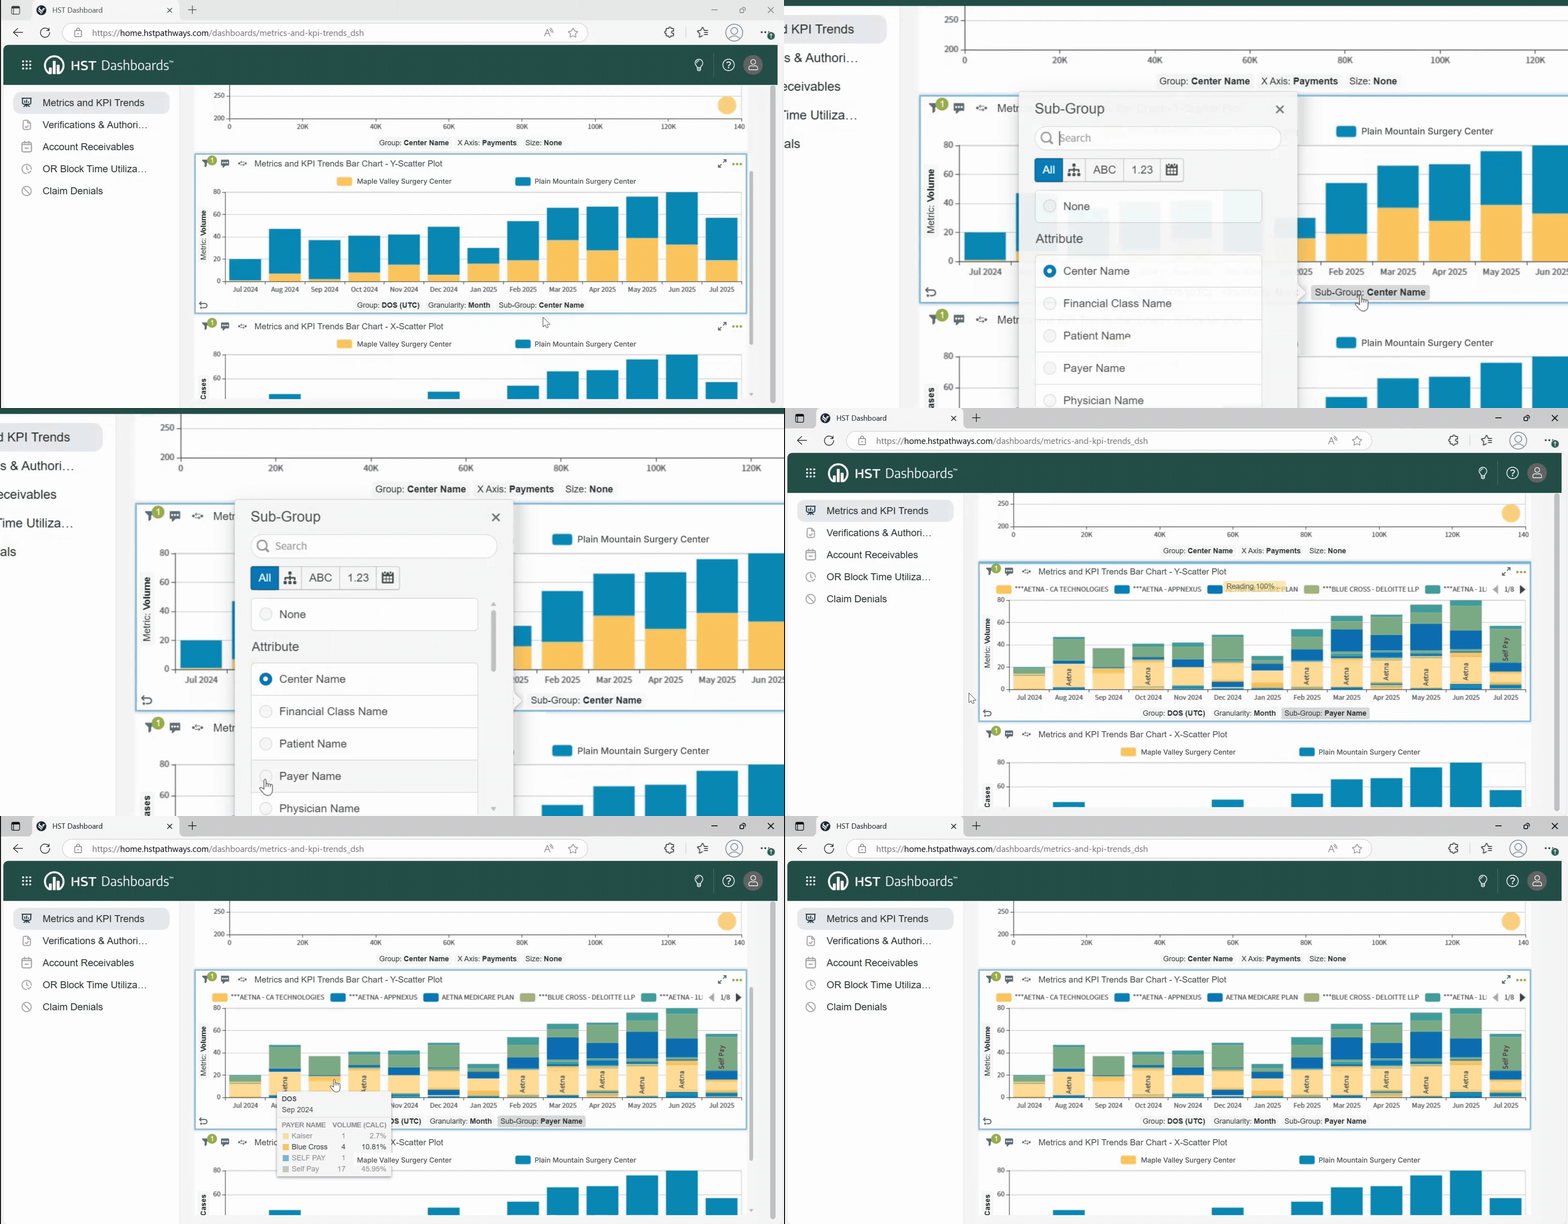
Metrics and KPI Trends
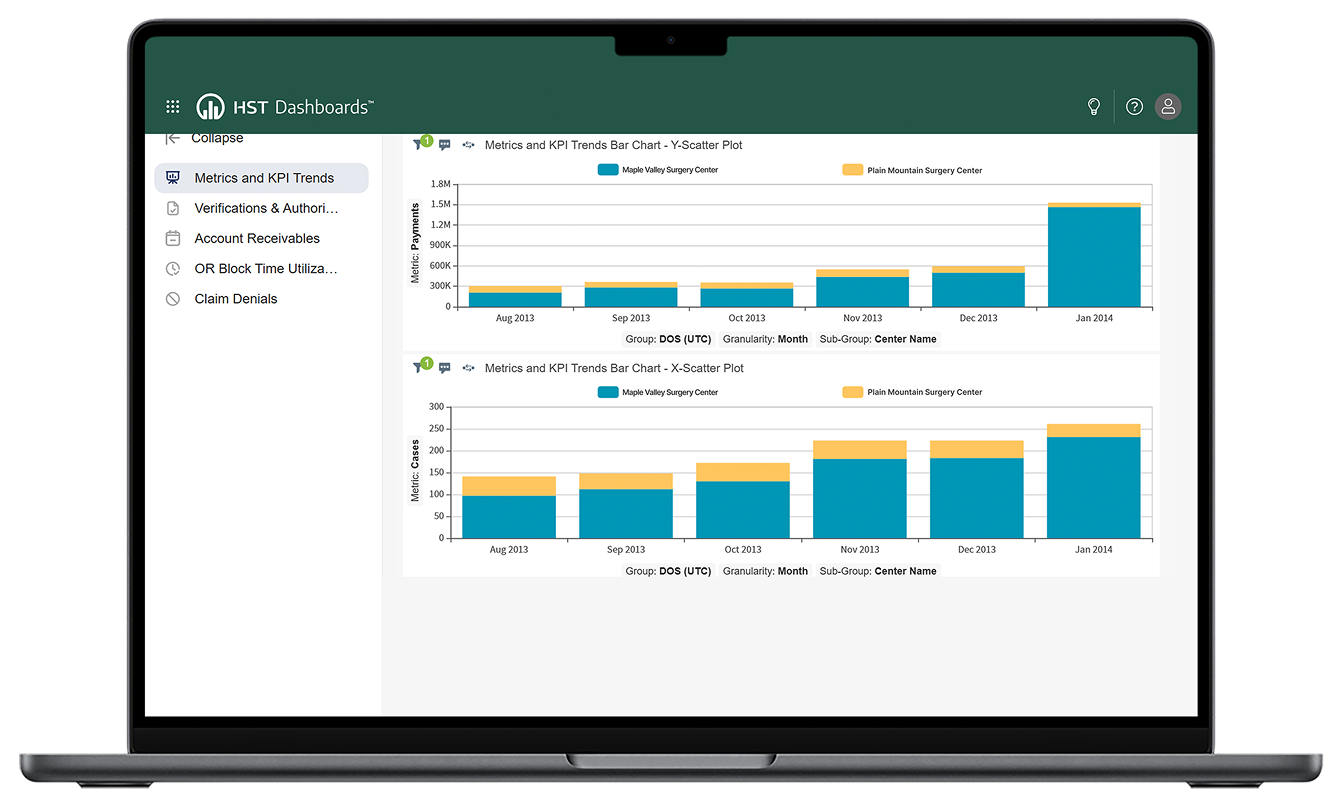
- Get a clear, detailed view of your ASC’s monthly net revenue and refunds.
- Review charts of cases by payments, monthly payments by admission date, and more.
- Use easy-to-read graphs to quickly identify patterns in revenue and refunds and improve your center’s financial planning.
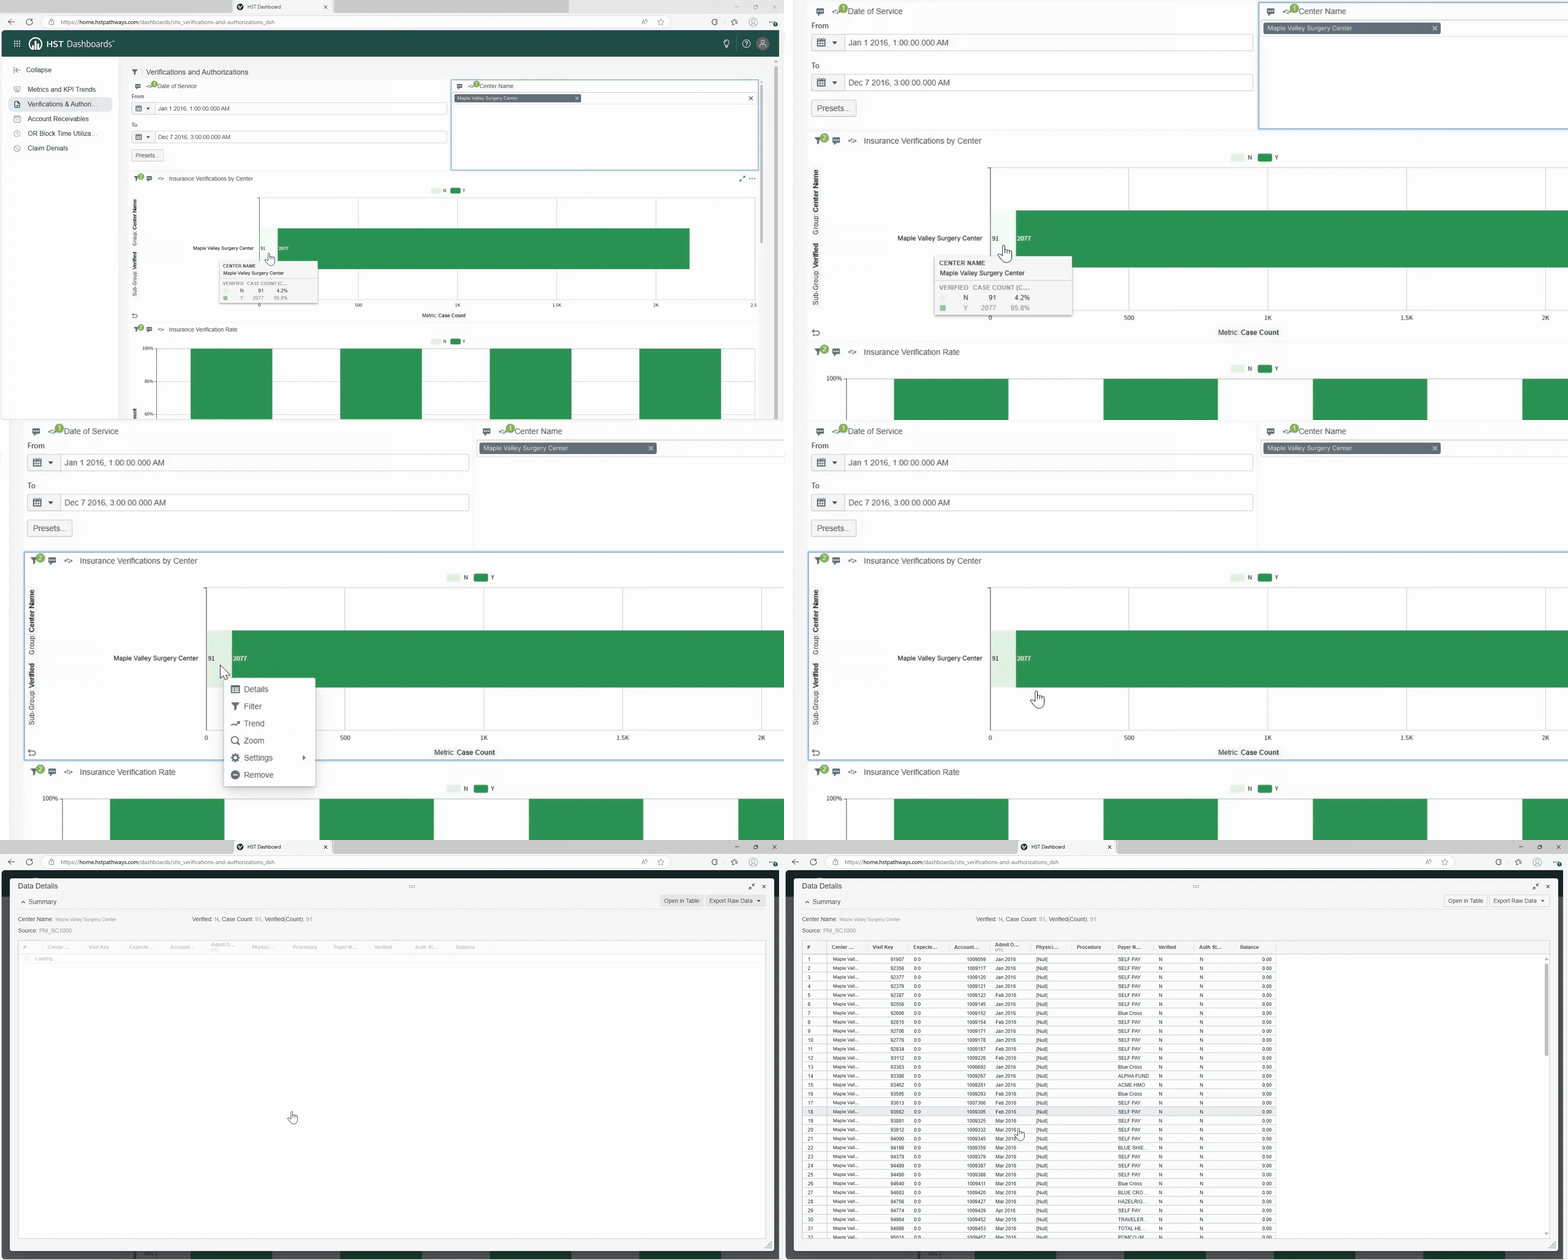
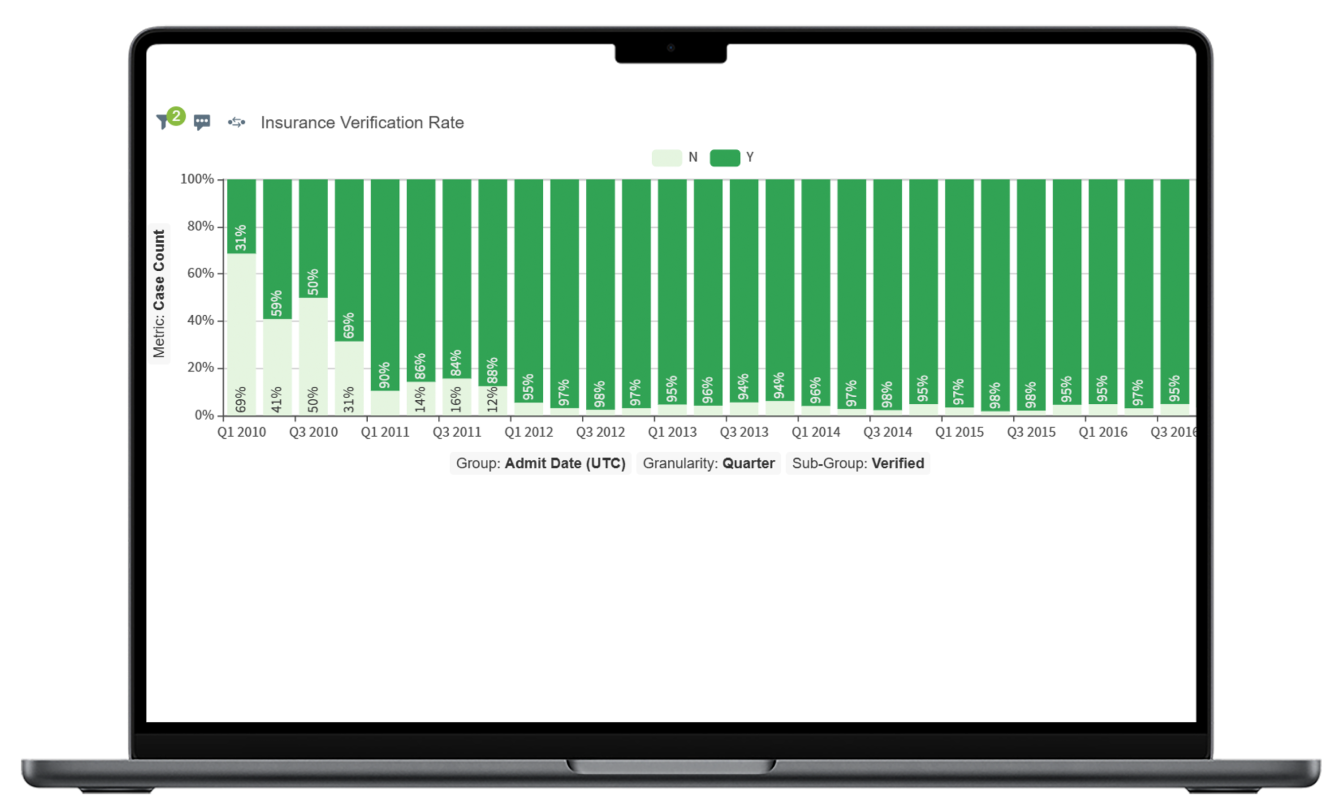
- Track insurance authorizations and verifications for each case, with clear indicators for verification and re-authorization status.
- View authorizations by date of service and individual cases.
- Help your staff complete approvals in advance, reducing last-minute surprises and delays in patient care.
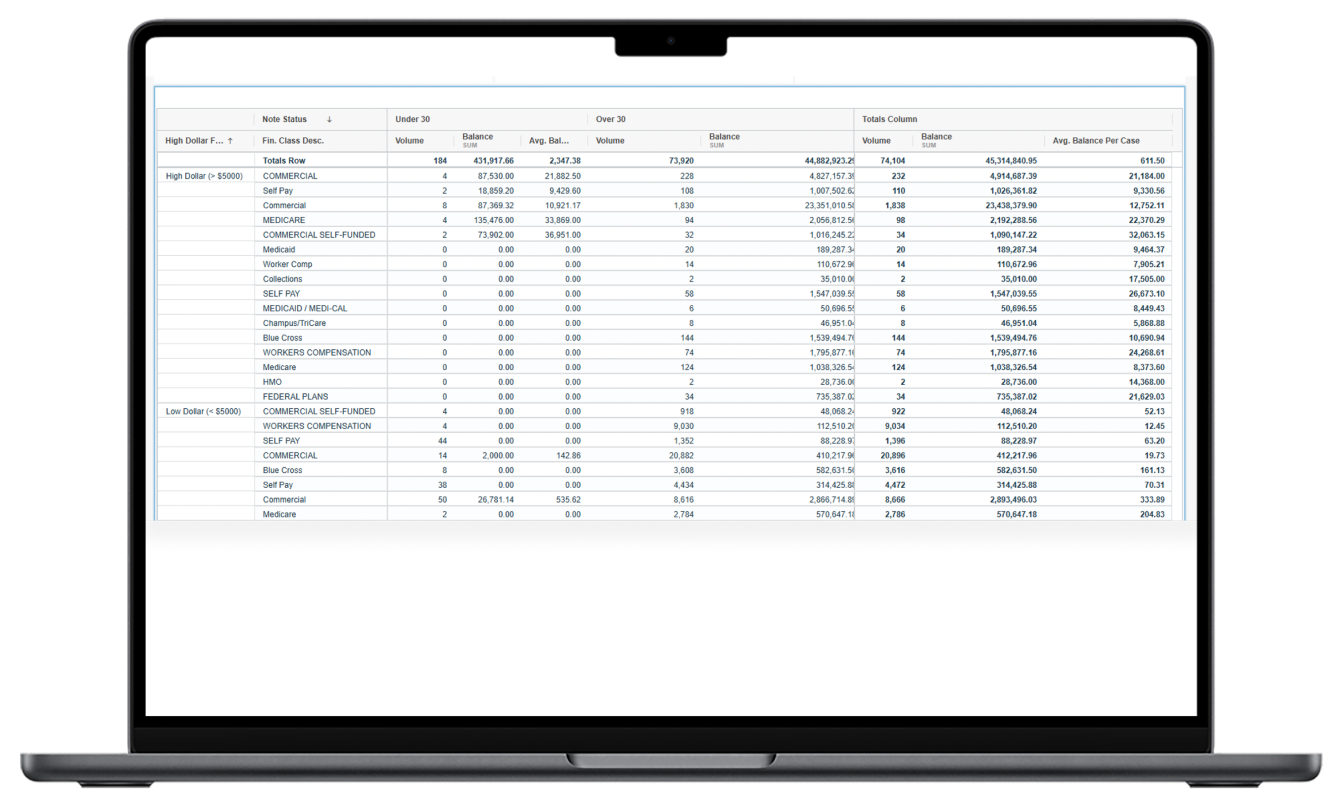
- Experience a full overview of your ASC’s accounts receivable (AR).
- Explore a complete breakdown of days not worked including the payer type, number of cases, and balance.
- Manage receivables more efficiently, identify bottlenecks, and keep your financials on track.
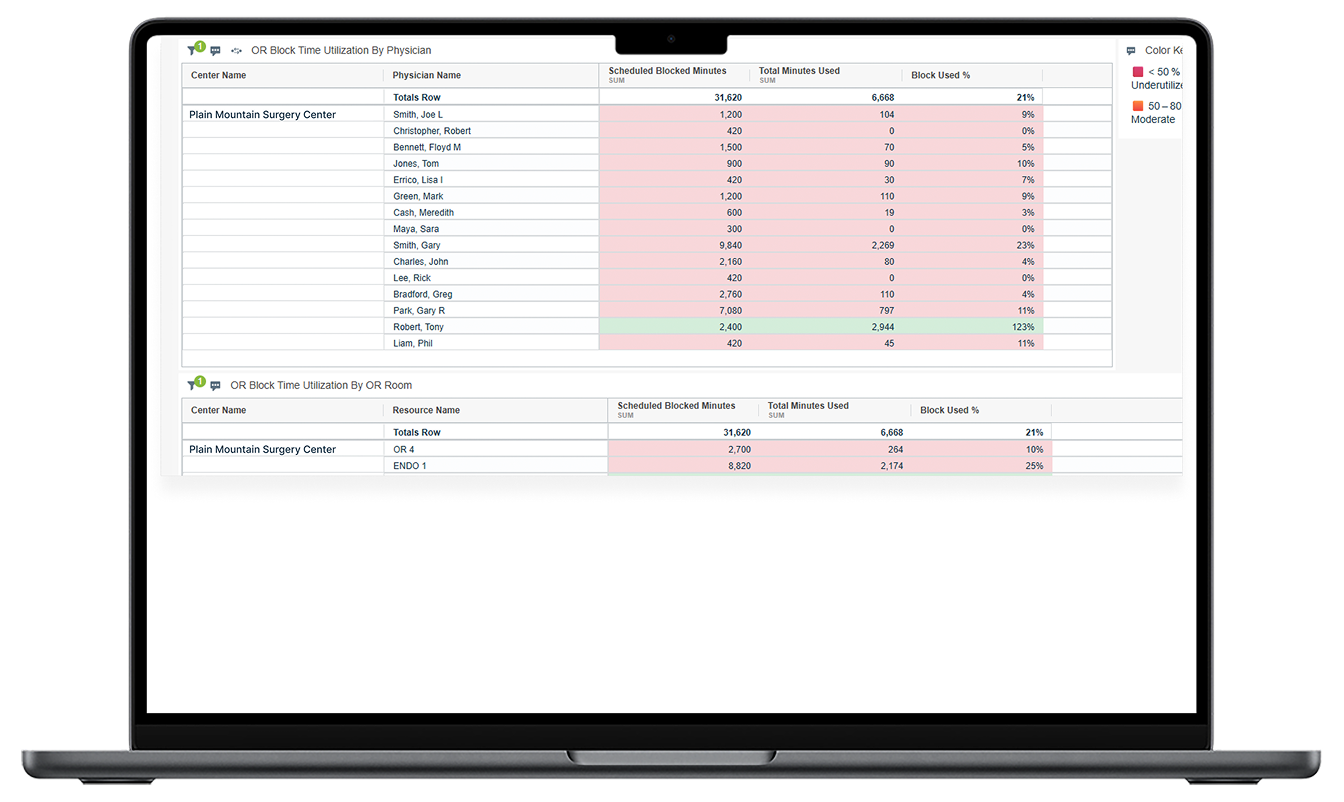
- See OR block time usage by week and physician in one easy-to-read visual display.
- Give your ASC a full view of OR block
time utilization. - View details on use by physician with insights such as scheduled blocked minutes, total minutes used, and use of block by percentage, making it easier to identify key trends.
- Keep your ORs are operating at their maximum capacity so you can increase your revenue.
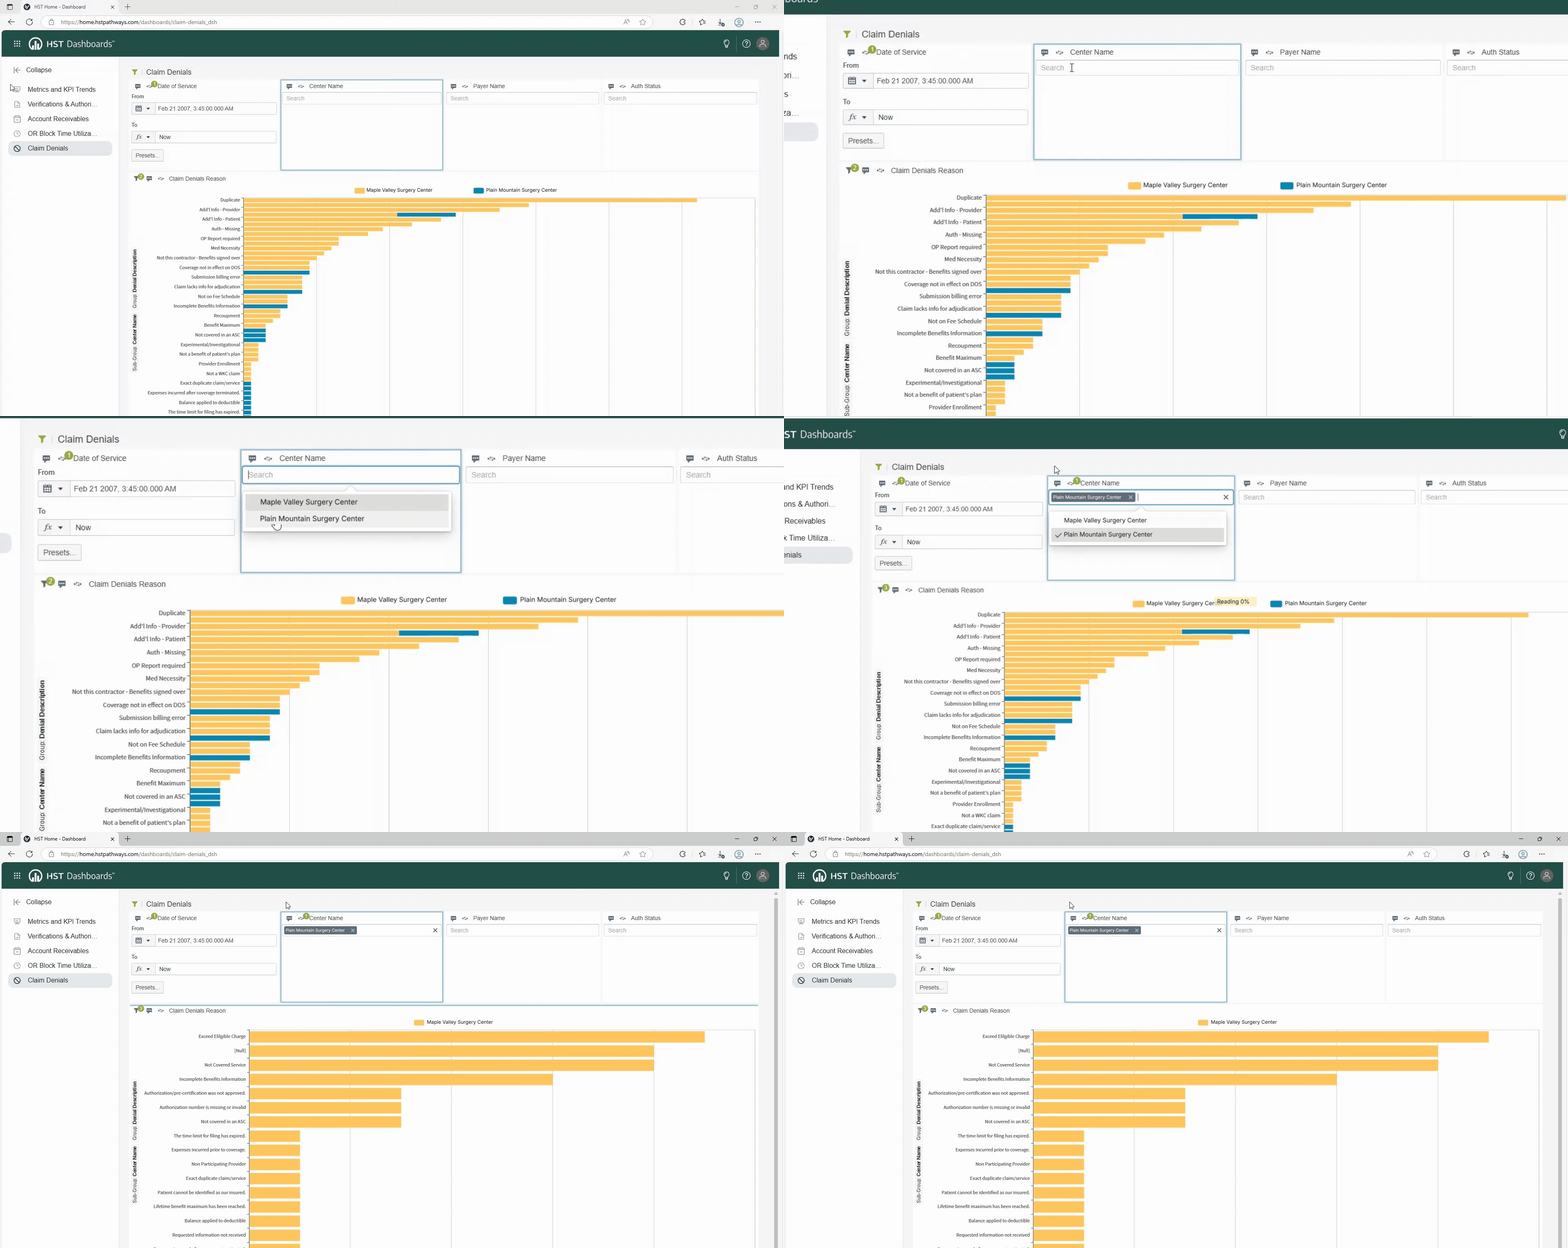
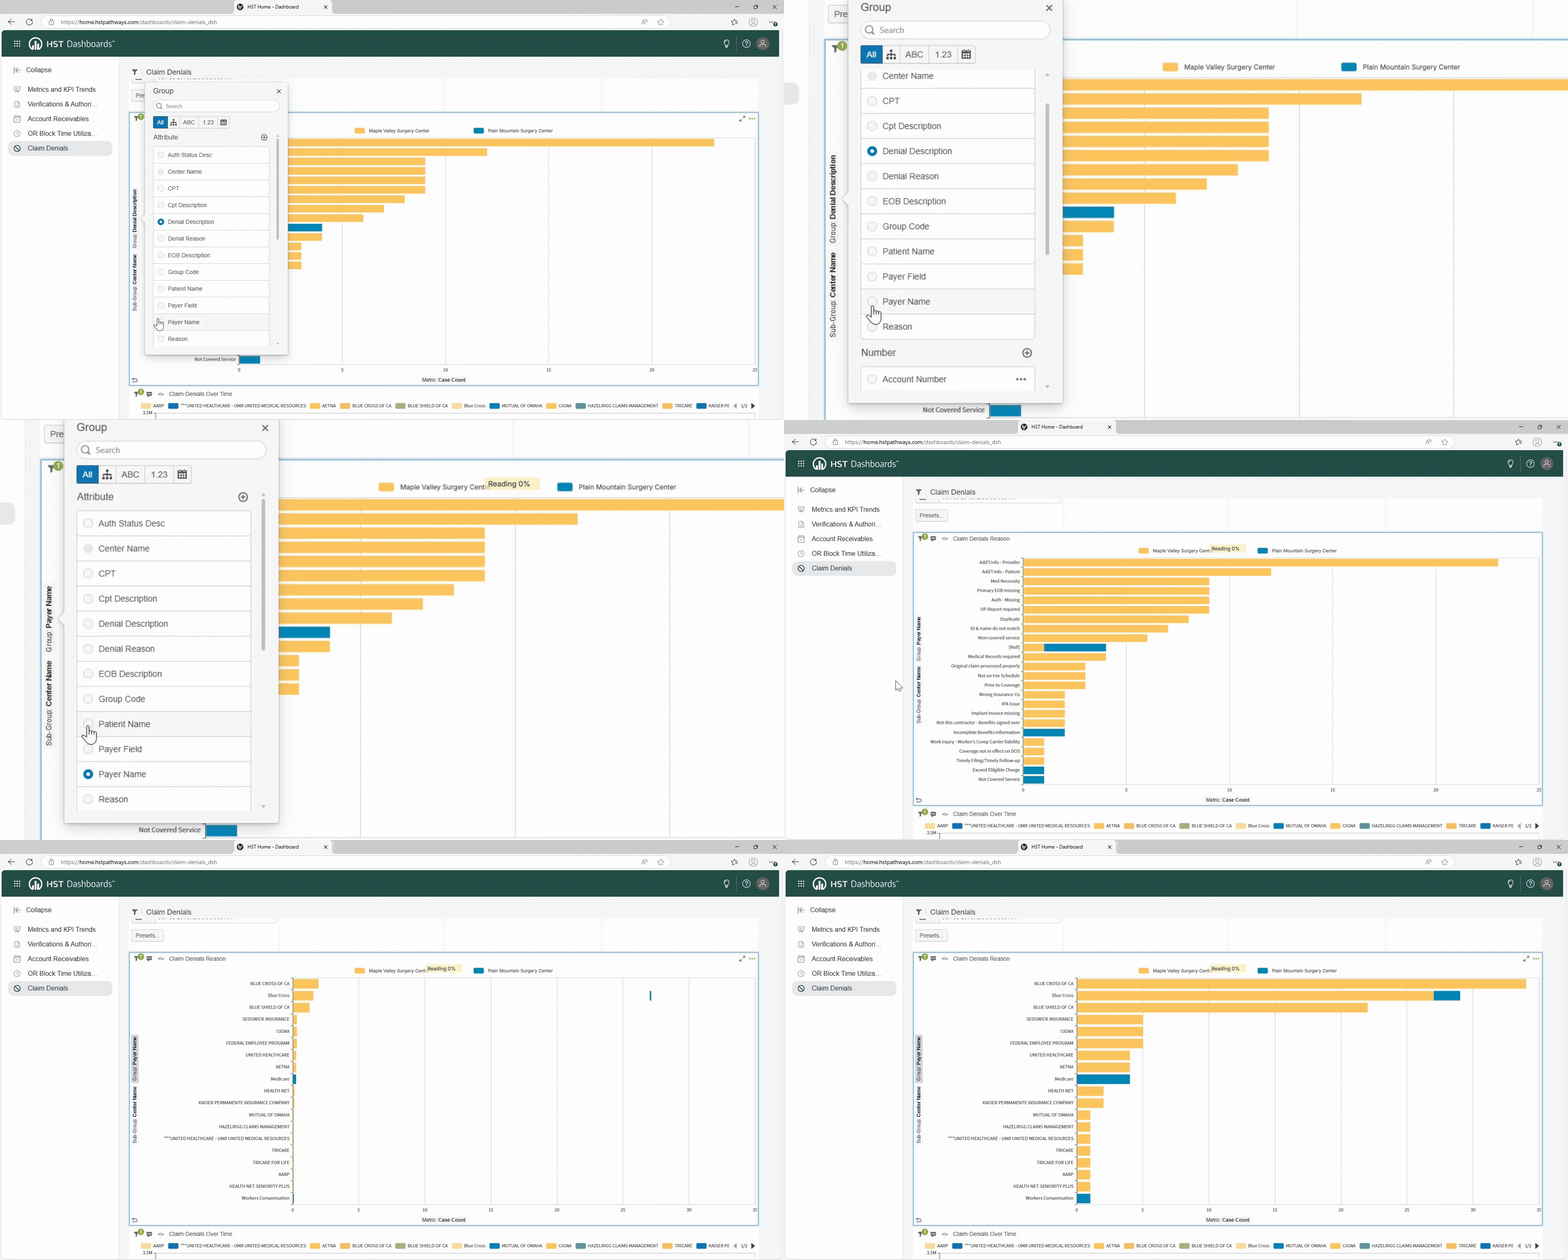
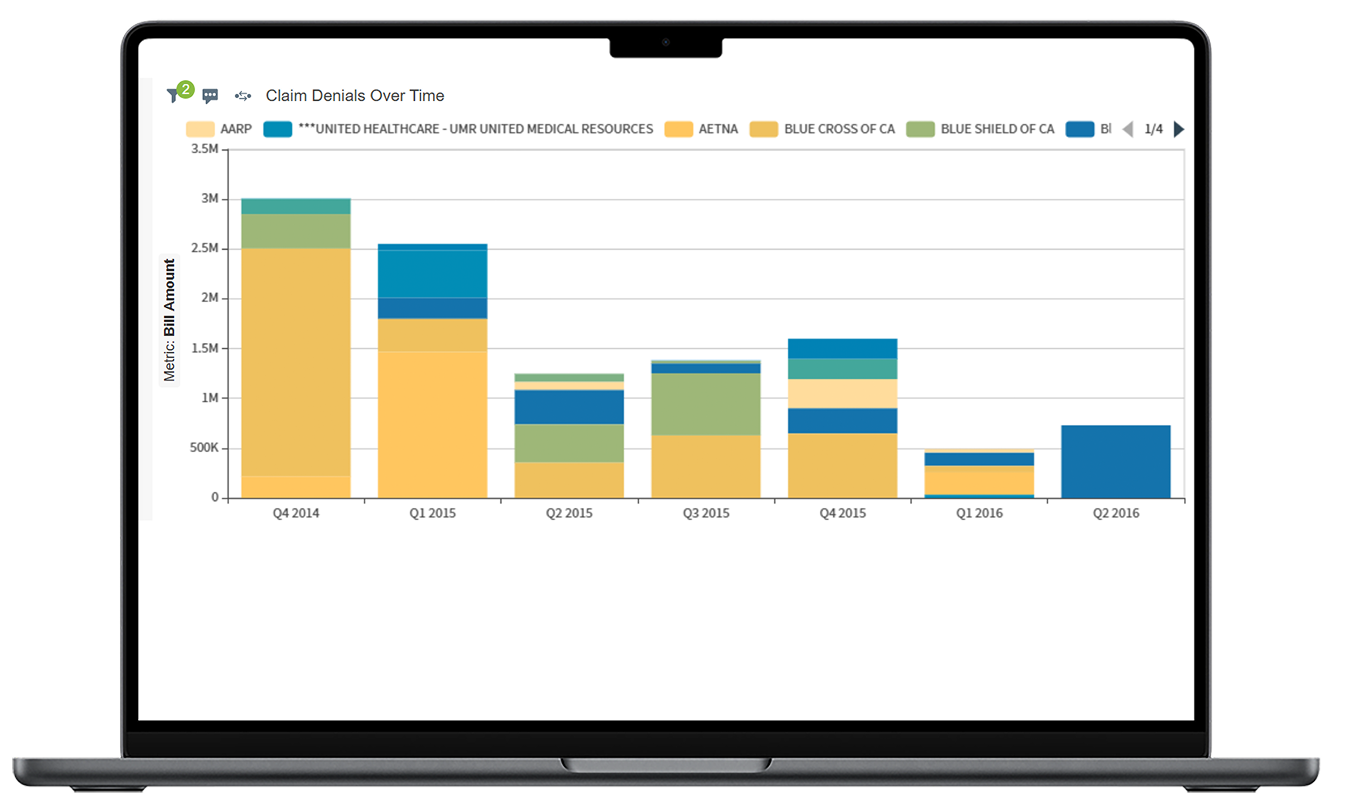
- See which payers deny the most and why claims are getting denied.
- Recover revenue and improve clean claim rates.
- Focus your billing team’s efforts where they’ll have the biggest impact and prevent future denials.
- Find out how much revenue is at risk so you can take action fast.
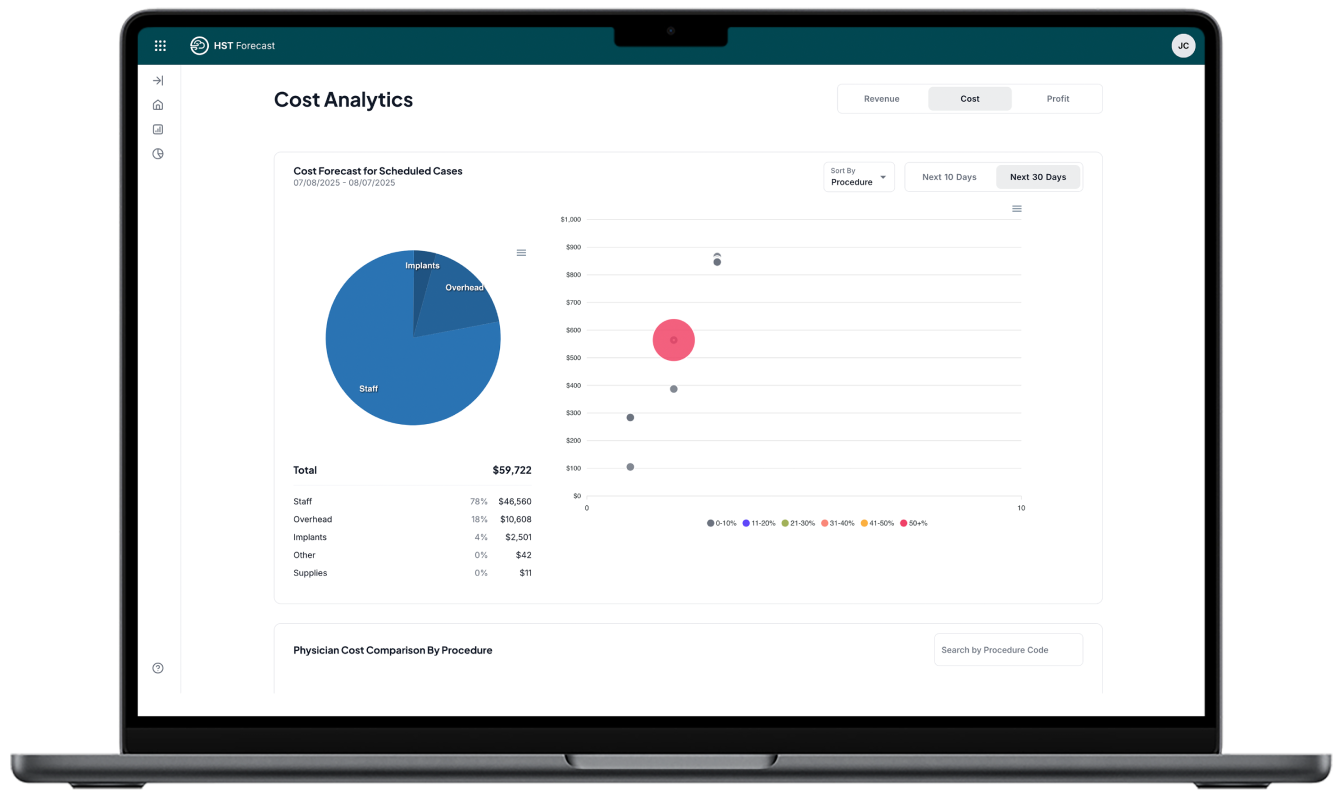
- Review projected costs for upcoming cases by physician and procedure
- Compare estimated costs to expected revenue to spot low-margin cases early
- Use cost insights to support better scheduling and supply planning
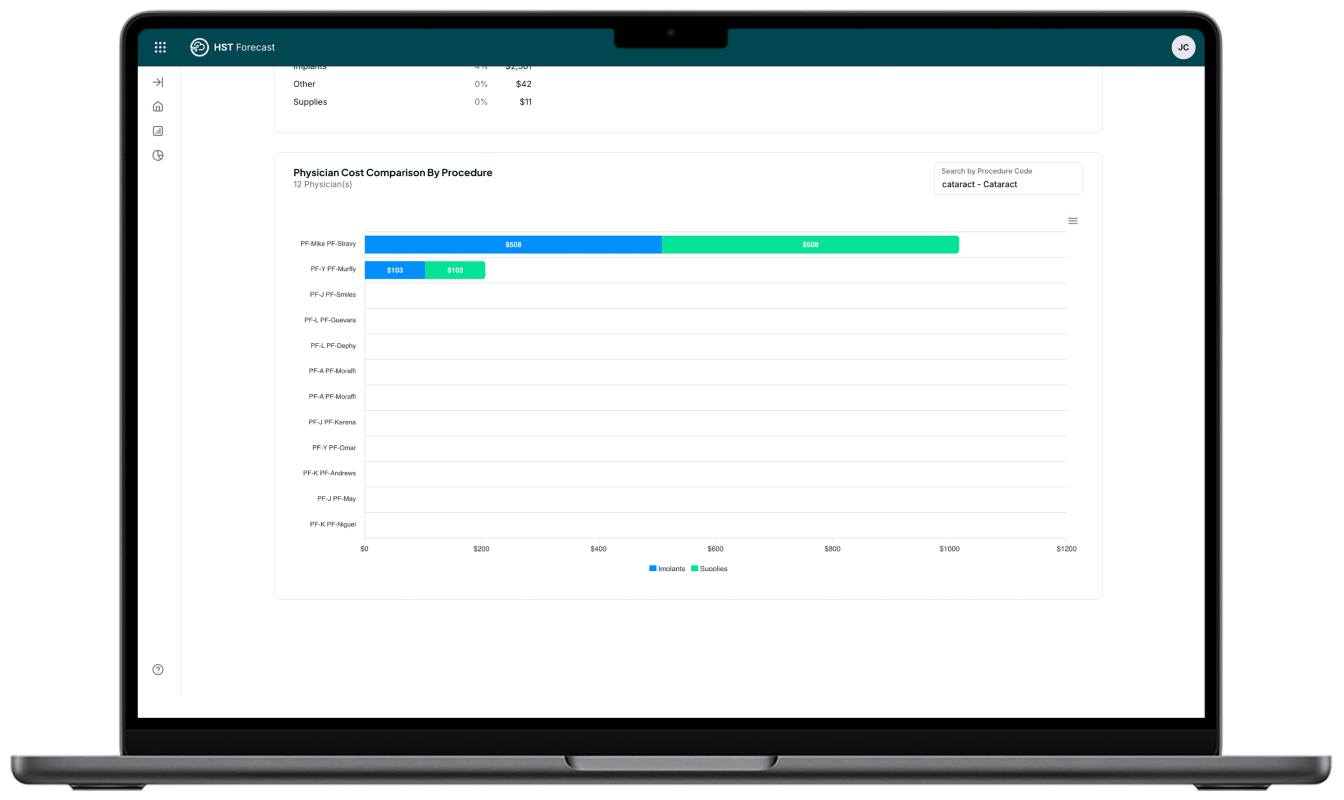
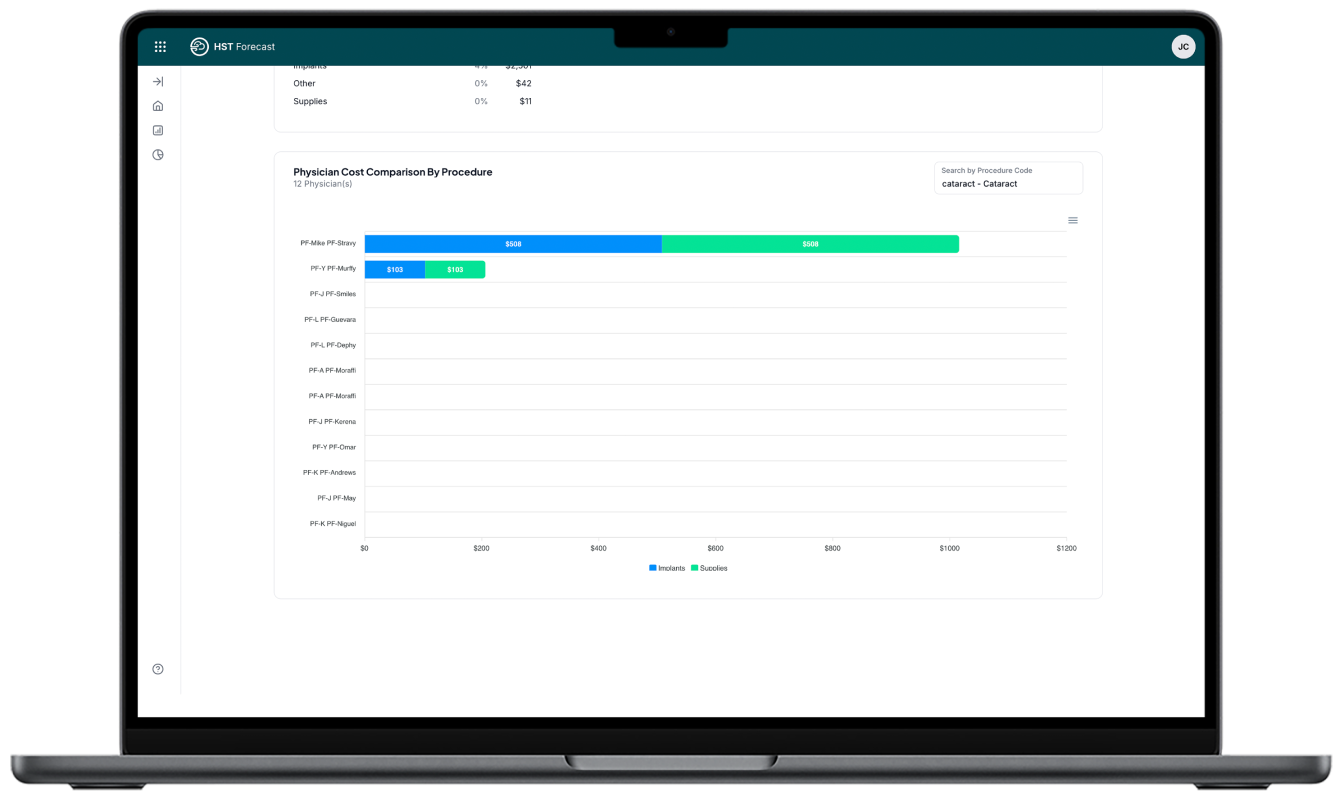
Physician Cost Comparison By Procedure
- Uncover implant and supply costs by physician for the same procedure
- Understand cost differences between physicians doing the same work
- Identify savings opportunities and reduce supply spend
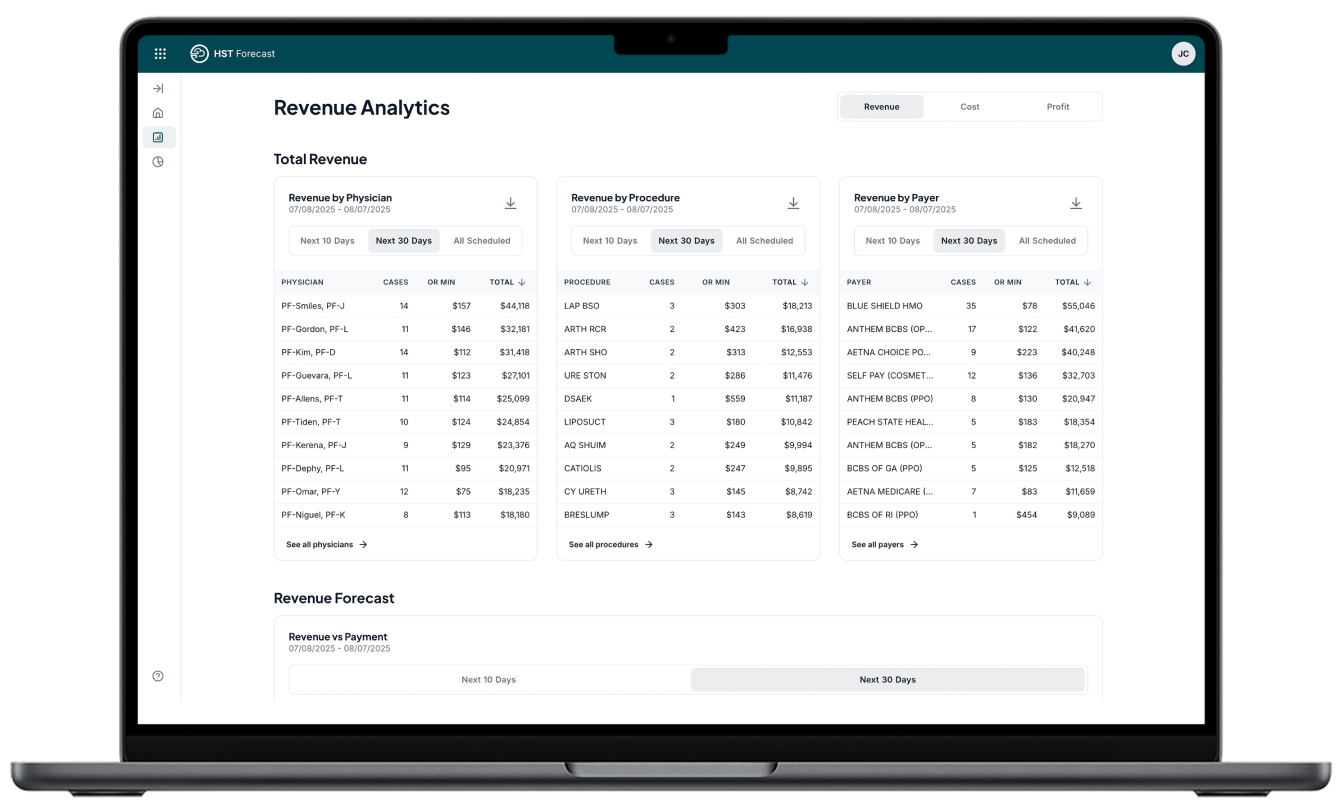
Revenue by Physician Procedure & Payer
- See forecasted revenue by physician to understand who’s driving the most income
- Explore revenue by procedure to spot your most valuable cases
- Break down revenue by payer to see which contracts bring in the most
- Track forecasted revenue for scheduled cases across upcoming weeks
- Compare expected income to actual payments as they come in
- Spot gaps early to improve cash flow and follow-up
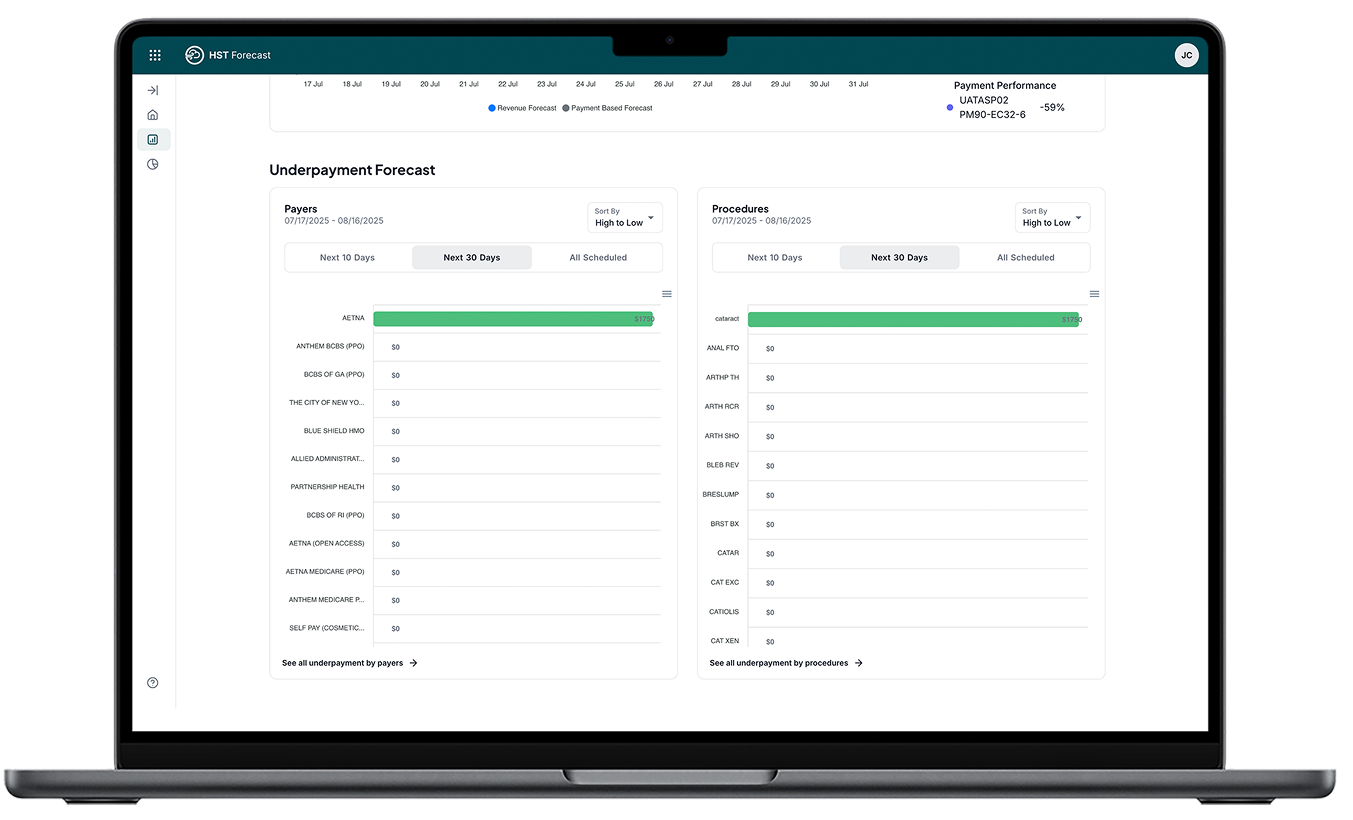
- View the difference between expected and actual payments by procedure
- Identify which payers are underpaying based on contract rates.
- Use data to support follow-up and reduce lost revenue
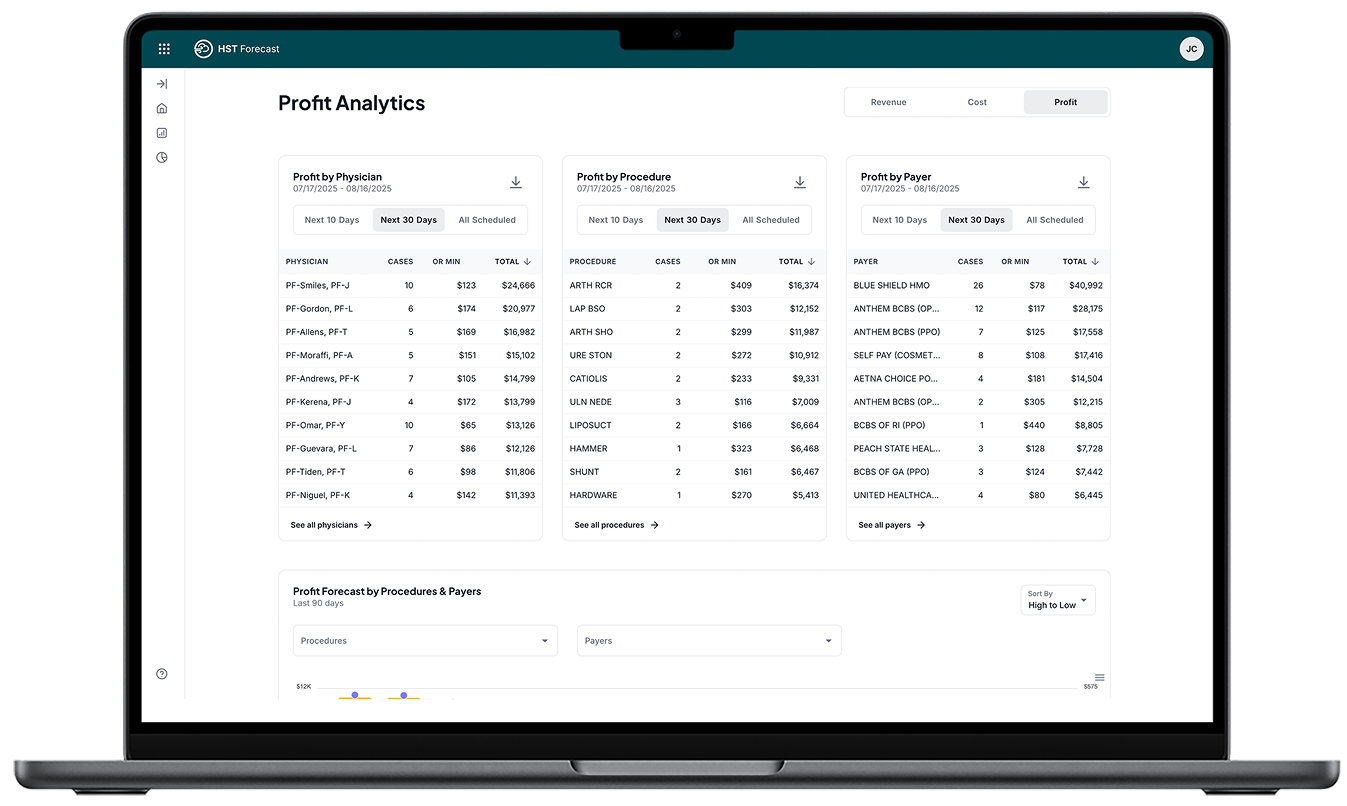
- View forecasted profit by physician to see who brings in the most margin
- Explore profit by procedure to understand which cases are most profitable
- Break down profit by payer to evaluate contract performance
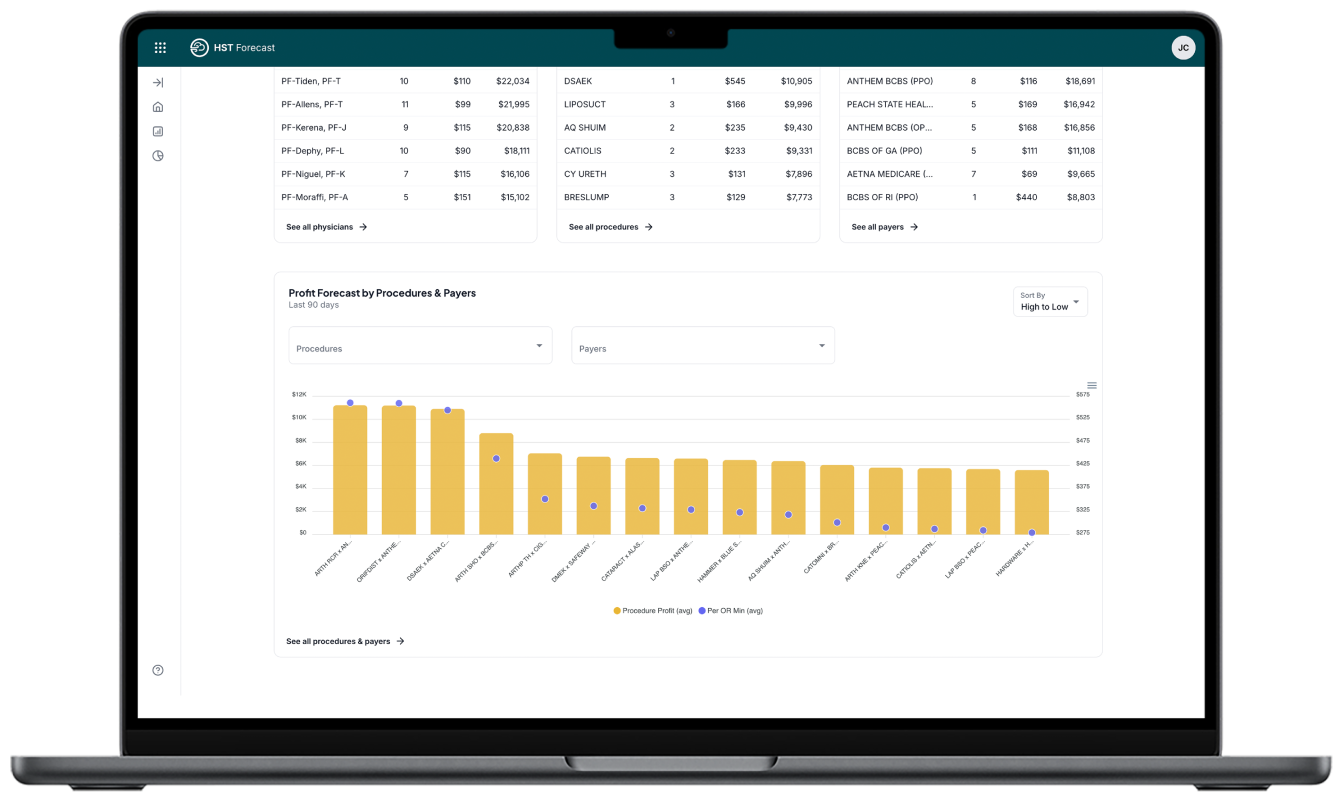
Profit Forecast by Procedures & Payers
- See forecasted profit for each procedure and payer combination
- Identify which contracts and procedures deliver the best margins
- Use insights to guide case selection and improve financial performance
YOU’VE GOT QUESTIONS,
We’ve Got Answers
How is HST’s dashboards different from other reporting tools?
Do I need to have any other HST solutions to use HST’s dashboards?
Do I need to be good with data to use it?
Can different staff members see different data?
Helpful Resources

3 Ways Data Integration Can Boost Your Surgery Center’s Data Management

Using Preference Cards to Lower Supply Costs

